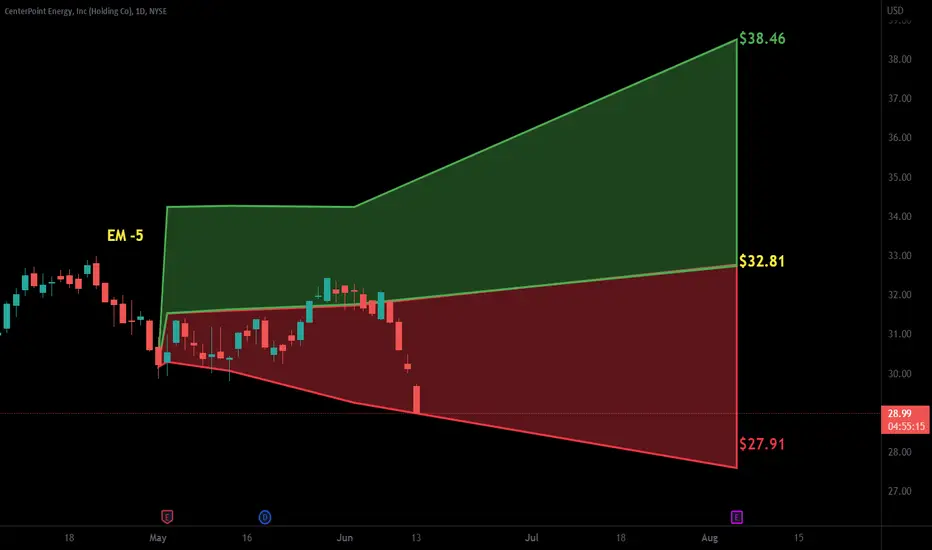
Continuation to 40s as we continue trendWith the hard-sought-out area within the red, the stock started to pick up traction; therefore, we are still bullish until the target is complete.
CNP trade ideas

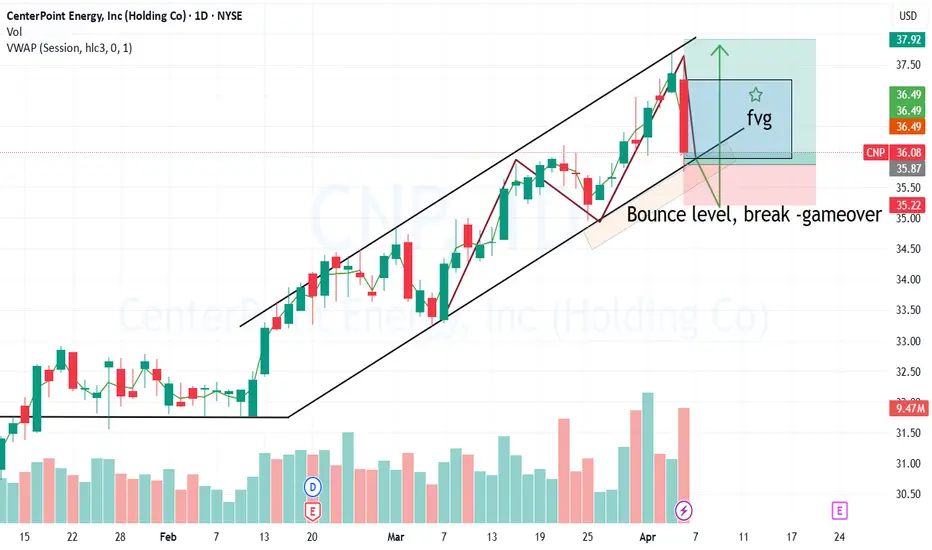
Great momentum, goes higher after the uptrend barely touchesWith meaningful data suggesting this is a pivotal moment, even charts can now change course and start a new bit of history, but we're keeping it simple: retest before you break down completely. Also, it may extend the stop loss to maintain confidence.
CenterPoint Energy (CNP): Energy Infrastructure ExpandsCenterPoint Energy, Inc. (CNP) is a utility company that provides electricity and natural gas to millions of customers across the U.S. With a focus on reliability and sustainability, CenterPoint is investing in grid modernization and renewable energy projects to support long-term growth. As energy demand increases, the company continues expanding its infrastructure and enhancing efficiency to serve more communities.
The stock chart recently displayed a confirmation bar with rising volume, pushing the price into the momentum zone, which occurs when it moves above the 0.236 Fibonacci level. This indicates growing investor confidence and the potential for continued upward movement.

CenterPoint Energy, Inc. (CNP): Expanding Energy InfrastructureCenterPoint Energy, Inc. (CNP) is a major player in the energy industry, delivering electricity and natural gas to millions of homes and businesses across the United States. The company focuses on reliable energy distribution while investing in grid modernization and renewable energy projects.
These upgrades aim to improve service efficiency and meet the growing demand for cleaner energy solutions. CenterPoint’s strong growth is fueled by its commitment to sustainability and expanding its infrastructure to serve a larger customer base.
On the stock chart, CenterPoint recently displayed a confirmation bar with increasing volume, indicating renewed interest and momentum. The price has moved into the momentum zone, suggesting a potential for continued upward movement. This combination of growth strategies and positive technical signals makes CNP a stock worth watching.

Bottom BuildingWe have reached a long term bottom. In October 2022 during Covid it has been reached the first time and then tested seriousely again 1 year later. Now, almost another year later we are facing this level again.
Meanwhile we have seen a downtrend that had ended in April this year.
When we see that the same level was the top in November 2020 already and has been besieged for several months in 2021 we may imagine that there may be some really important level that may hold another time.

CNP possible upward move on Day ChartThank you for your time
The SRSI readings are healthy
The bottoms search man and Top/bottom indicator recently flashed a bottom in.
It is culminating in a Descending triangle pattern.
There is good probability that CNP may break to the upside.

Seeking for Opportunities in Advancing MomentumIn seeking opportunities in the prevalent momentum in the utility sector, I will consider going long on a breakout to the upside of the resistance level.


$CNP with a Neutral outlook following its earnings #Stocks The PEAD projected a Neutral outlook for $CNP after a Positive over reaction following its earnings release placing the stock in drift B with an expected accuracy of 60%.

CenterPoint Energy Inc.Shares of CenterPoint Energy Inc. CNP, +0.33% inched 0.33% higher to $30.45 Friday, on what proved to be an all-around dismal trading session for the stock market, with the S&P 500 Index SPX, +0.41% falling 0.73% to 3,934.38 and Dow Jones Industrial Average DJIA, +0.71% falling 0.90% to 33,476.46. The stock's rise snapped a two-day losing streak. CenterPoint Energy Inc. closed $3.05 below its 52-week high ($33.50), which the company achieved on September 23rd.

BUY CNP The dividend payment is safe.
The utility sector outperform the S&P 500.
CenterPoint Energy also has a projected 6-8% adjusted utility EPS long-term growth from 2021 to 2025.
The new CEO has highly impressed us with his energy, vision, and passion for the business. We fully expect him to drive outperformance for the company.
CNP made a great deal with ET to unload its midstream assets.
Management believes the company is on the path to deliver 10% compound annual rate base growth over 5 years.
The stock is oversold. Selling Volumes slows last week

$CNP with a Neutral outlook following its earnings #Stocks The PEAD projected a Neutral outlook for $CNP after a Positive over reaction following its earnings release placing the stock in drift B with an expected accuracy of 55.56%.

CNP - Breakout to Red ResistanceCNP has been in this up channel for awhile, constantly it has been rejected at the upper channel line
I believe it will breakout this time however with a test of a previous support in red
Green bars pattern showing the breakout to red line

CNP Bullish Price closed above the (weekly) trend line in addition to breaking out of the rising wedge on the daily.
The close above 1 Fibonacci level and 32.67 (prior resistance) is a bullish signal, especially given the strength of the candle.
D+ crossed th D- indicator on the ADX and the MACD is also curling up for a MACD cross.
Force Index (13), (2) are both positive and OBV is confirming the recent price action.
2 x ATR stop at $31.42
Target: $35.80

$CNP with a Bullish outlook following its earnings #Stocks The PEAD projected a Bullish outlook for $CNP after a Positive Under reaction following its earnings release placing the stock in drift A with an expected accuracy of 57.14%.
CNP about to break outUtility sector has been very strong over the year. The oil price appears to go up next year and is going to push the energy sector stocks higher. The double bottom in the weekly timeframe is pushing the price higher and the symmetrical triangle is about to break to the upside.

CNP BullishYesterday's candle tested two fibonacci levels to close above the .382 level. Also the MACD is crossing and the 9ema is also crossing the 20 ema showing a strong short term up trend. The RSI is still cool.
I think CNP will return to its prior highs sooner than later.
Targeting: $25.81, $26.16


Head and shoulders bear ideaCenterPoint Energy, Inc. CNP
Technical Pattern: Head and Shoulders Top
Outlook:Bearish
Long Term Target:15.71
Current Price:20.75
Idea Generated at:Mar 8, 2021
This stock has formed a pattern called Head and Shoulders Top, providing a target price for the long-term in the range of 15.30 to 16.20.

Traditional|CNP|Long and shortLong and short CNP
Activation of the transaction only when the blue zone is fixed/broken.
Working out the support and resistance levels of the consolidation zone.
* Possible closing of a trade before reaching the take/stop zone. The author can close the deal for subjective reasons, this does not completely cancel the idea and is not a call to the same action, you can continue working out the idea according to your data, but without the support of the author.
The "forecast" tool is used for more noticeable display of % (for the place of the usual % scale) of the price change, I do not put the date and time of the transaction, only %.
The breakdown of the upper blue zone - long.
Breakdown of the lower blue zone - short.
Working out the stop when the price returns to the level after activation + fixing in the red zone.
Blue zones - activation zones.
Green zone - take zone.
Red zone - stop zone.
Orange arrows indicate the direction of the take.
Red arrows indicate the direction of the stop.
Priority - The value of the priority parameter implies the author's subjective opinion about the more likely activation zone on this idea, this does not mean that this idea will be 80% activated by this parameter, the purpose of the parameter is to provide for the risk of the inverse of the zone parameter.
Example: "Priority Long: So the author inclines more in the direction of the activation zone open long trades, in this case, when reaching the activation zone in short you should be very careful, because this area may be highly likely to be punched about the breakdown/do not get to take/activate transaction from go to stop."
Please consider this parameter if you use my ideas.
SUM PNL: This parameter displays the total % of all closed ideas of the "new" format (according to the author) for this sector at the time of publication of the idea. The calculation is very "clumsy" just the sum of the profits of all the ideas, based on this indicator, you can more accurately assess the risks when working with my ideas of this sector. I present you the construction of the idea, you can use it yourself as you like based on your subjective view and risks, the calculation of the PNL indicator is carried out only on transactions that the author closed on TV in manual mode or by take.
P.S Please use RM (risk management) and MM (money management) if you decide to use my ideas, there will always be unprofitable ideas, this will definitely happen, the goal of the system is that there will be more profitable ideas at a distance.

CENTERPOINT ENERGY Opinion DailyHey guys, CENTERPOINT ENERGY is in a bullish momentum with a return of buying volume traded in a hammer candle shape. In TIMEFRAME M1 we see a candle an upside down tombstone and a weak explosion on the purchase volume made. It bounced off the base of the bollinger to test it, then went to its high again and went to the top of the consolidation zone to check it. Great potential to breakout the price with the momentum of both the area to join another and land on the next higher.
Before a new higher for the breakout an area with an excess (on TIMEFRAME H4) propability on the second higher. And an excess for the attempt to fill the bearish breakout gap (on TIMEFRAME H1). No buying push to test the intermediate median of ANDREWS PITCHFORK.
Please LIKE & FOLLOW, thank you!

Centerpoint EnergyIt has been a while since my last post but so what. You only want me for my huge sack anyway! Not sure if you have been watching but energy has been on a move lately. It is moving for several reasons, super cold weather in the USA, reduced global production, and my favorite inflation. Looking at the chart I have placed two different potentials.
First, and what I believe to be most likely is that if the stock market doesn't crash next week, the price of this stock will break free of the Symmetrical Triangle . It appears upon closer examination that there is a lot of pressure to break out above the triangle. If the price rises above ~21 bucks it will rise to about 25 before settling back to the trend line before rocketing up to the $30 target. We are about to see stimulus checks, Tax returns and a lot of other things to drive consumption to a market that cannot currently keep pace with demand. Meanwhile, more and more Americans lose there jobs. Stagflation is coming. But why not take some profits along the way and keep building to that tiny sack you have. I also like that it has a dividend at 2.99% not bad get paid for holding it and get paid for owning it. It is like a sack inflator.
However, if the pressure breaks down it could be even more dramatic than my 3 wave pattern. Why do you ask? it is because the world is a strange place and history rhymes. Next week is close enough to the 1 year anniversary of the last correction just before the world plunged into COVID hysteria... If we had reason to see the market burn last year all we have done since then is provide more fuel for that fire to really get cooking. In which case I will move a bigger sack to SPXS very quickly. The point of showing the downside is to say I would not buy back in I would wait for a trend reversal. This is not a falling knife I want to catch. The bottom could very well be much much lower.
Overall, if I see it move past the $21 level I am in good shape to buy more. I will be keenly watching for the break up or break down. Pennies to the downside for this trade dollars to the upside.
Let me know what you think of this perspective. Going pretty basic here on the analysis. Let me know if you want to see it a little more in depth.

Stocks are our friends🤝New week, wolves🔥
Today we want to give you one more opportunity to win and make money.
CNP (CENTERPOINT ENERGY INC) has created symmetrical triangle on small frame. There was a strong bullish sentiment before and now the price is in consolidation.
We don't predict, we react. So follow the chart and look for the breakout carefully.
If you enjoy my FREE Technical Analysis , support the idea with a big LIKE👍 and don't forget to SUBSCRIBE my channel, you won't miss anything!
Feel free to leave comments✉️
