CPS – Short Trade Setup!📉 🔴
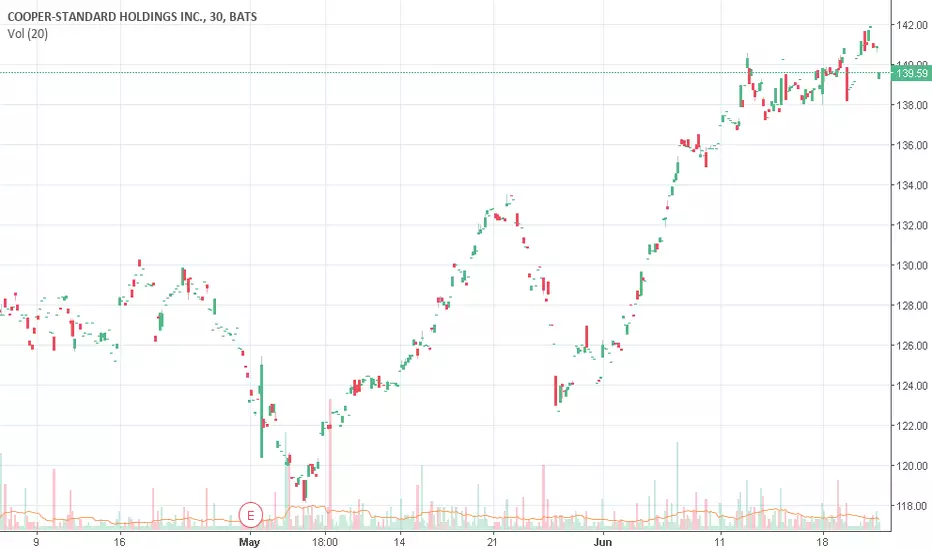
Ticker: CPS (Cooper-Standard Holdings Inc., NYSE: CPS)
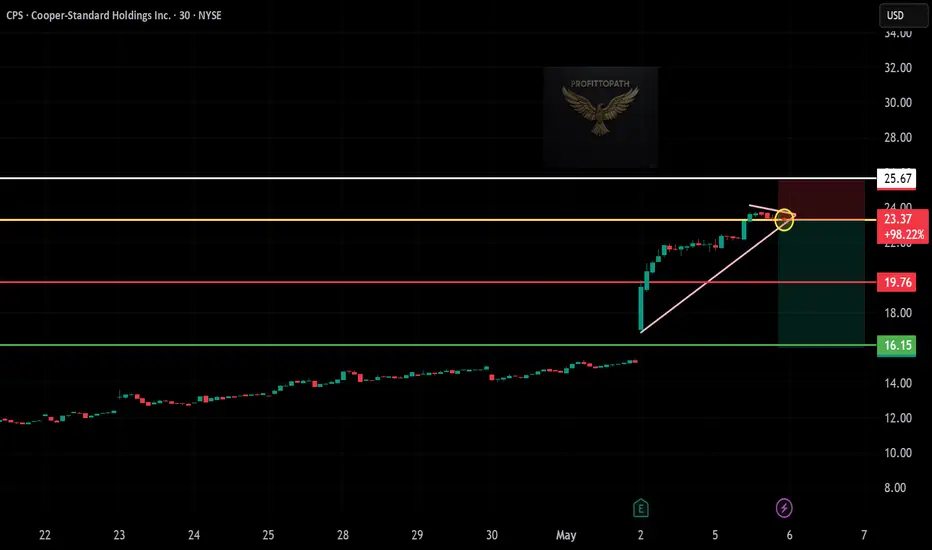
Chart: 30-Minute Timeframe
Pattern: Rising wedge breakdown + trendline rejection
🔻 Entry: $23.37 (break below wedge + resistance rejection)
🔻 Stop-Loss: $25.67 (above wedge breakdown and structure)
🔻 Take Profits:
• TP1: $19.76 – First support zone
• TP2: $16.15 – Measured wedge breakdown target
⚖️ Risk-Reward:
• Risk/Share: $2.30
• Reward to TP2: $7.22
• R:R Ratio: ~1:3.1 ✅
🧠 Technical Highlights:
– Rising wedge pattern broken to downside
– Strong rejection at key resistance (yellow zone)
– Bearish confirmation after breakdown with retest
CPS trade ideas
Wyckoff Logic Supply and DemandCOOPER Subvaluation!
Technical analysis
Cause, equilibrium sequence between demand and supply between quotas , supply zone 42.50 & 6.85 demand zone .
Demand and Supply, equilibrium = ⏹ range ("the ratio between supply and demand is =")
Implications,neutral!
Pattern consolidation!
Effect generated by approx
1800% .
⭕ = circle
⏹ = square
🔺️ = triangle
Unit = ⭕ market
Polarity = 🔺️demand & 🔻supply
Equilibrium = ⏹ range ("the ratio between supply and demand is =")
PRINCIPLE OF DEMAND AND SUPPLY
The law of supply and demand
- here the analysts study the relationship between supply and demand , having as a reference point the price and
volume over a period of time as shown on the chart.
KEY DEFINITION
The law of supply and demand is of the utmost importance. If the application to
buy an instrument (currency pairs, stocks, commodities , metals, bonds, cryptocurrencies)
is higher than the available supply, the only way the demand can be met is
for the price to rise to a level that attracts enough supply to match demand.
When this point is reached, the price does not advance. If the offer to sell is
higher than the demand to buy, the only way the supply will be absorbed is as
the price drops to a point that attracts enough demand to absorb all
the amount. When that happens, the price doesn't go down.

CPS likely to continue downtrendBased on historical movement, the peak could occur anywhere in the larger red box. The final targets are in the green boxes. The pending bottom should occur within the larger green box as has been the historical case. Half of all movement has ended in the smaller green box. In this instance, the signal indicated SELL on June 3, 2022 with a closing price of 5.72.
If this instance is successful, that means the stock should decline to at least 5.675 which is the top of the larger green box. Three-quarters of all successful signals have the stock decline 2.502% from the signal closing price. This percentage is the top of the smaller green box. Half of all successful signals have the stock decline 4.91% which is the end point of the black dotted arrow. One-quarter of all successful signals have the stock decline 9.026% from the signal closing price which is the bottom of the smaller green box. The maximum decline on record would see a move to the bottom of the larger green box. These are the same concepts for the levels in the red boxes as well.
The ends/vertical sides of the boxes are determined in a similar fashion. The trough of the decline can occur as soon as the next trading bar after signal close, while the max decline occurs within the limit of study at 40 trading bars after the signal. A 0.75% decline must occur over the next 40 trading bars in order to be considered a success. Three-quarters of successful movement occur after at least 9.5 trading bars; half occur within 20.0 trading bars, and one-quarter require at least 34.0 trading bars.
The black dotted arrow represents median historical movement. Medians are a good metric, but they are just one of many I use when forecasting future movement.
As always, the stock could decline the very next bar after the signal without looking back (therefore the red boxes would not come into play) or the stock may never decline (and the green boxes may never come into play).

CPSCPS trending using a Ichimoku cloud. Downward trending for the past 3 years. Looking for the rebound


CPS Detected possible stock repurchase!!!CPS: cooper std hldg inc
2018-06-20 17:16:04
Detected possible stock repurchase