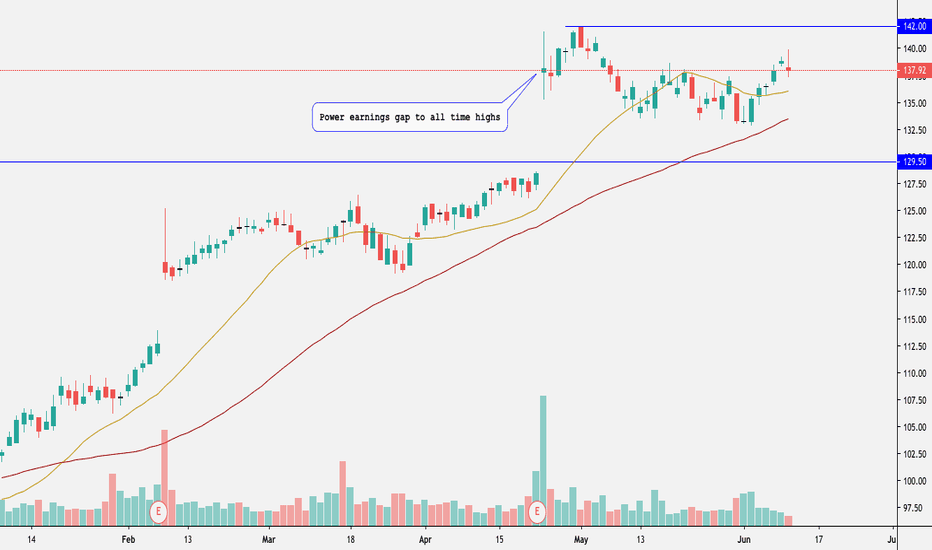
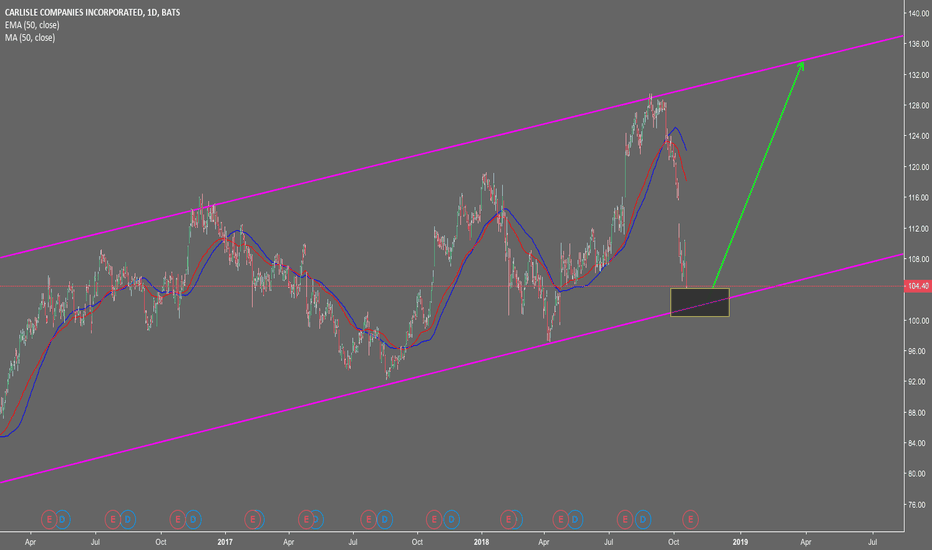
Carlisle trading above channelCarlisle Cos Inc. (CSL) presently trading above significant channel resistance. If a weekly settlement above this channel resistance occurs, this would place (CSL) in a buy signal where gains of 15% would be expected within 2-3 months, and 20-25% within 5-8 months. Inversely, if (CSL) does not manage to close above the channel resistance, the market may turn bearish with anticipated losses of about 20% over the next 2-3 months.
CSL trade ideas
$CSL continuing to move higher!Notes:
* I last spoke about this a couple of days ago as it was bouncing off of its 50 day line
* Since then it has gaped up and is now breaking above the resistance level of $254.44
* It's still offering an early entry as it's still close to its 50 day line and trading above average volume
* Everything else remains the same from my previous post.
Technicals:
Sector: Industrials - Building Products & Equipment
Relative Strength vs. Sector: 1.39
Relative Strength vs. SP500: 1.43
U/D Ratio: 2.03
Base Depth: 17.07%
Distance from breakout buy point: -5.86%
Volume 3.18% above its 15 day avg.
Trade Idea:
* This is still giving a pretty low risk entry opportunity so you may look to enter now as it's breaking above the 254.44 level
$CSL finding support at its 50day line. Can it move higher?Notes:
* Great earnings
* Very strong up trend on all time frames
* Pays out dividends
* Showing tonnes of strength and accumulation
* Basing for the past 4 months while the general market and the respective sector took a nasty hit
* Currently finding support at its 50 day line
* Printed a Pocket Pivot
Technicals:
Sector: Industrials - Building Products & Equipment
Relative Strength vs. Sector: 1.21
Relative Strength vs. SP500: 1.23
U/D Ratio: 2.04
Base Depth: 17.07%
Distance from breakout buy point: -7.58%
Volume 33.16% above its 15 day avg.
Trade Idea:
* You can get in right now as the price is finding support along its 50 day line and is currently bouncing off of it with higher than average volume
* If you're looking for a better entry you might find one around $245.3
* Or if you want a safe entry you can buy at the break above 254.44
* This stock usually has local tops when the price closes around 11.2% above its 50 EMA
* Consider selling into strength if the price closes 11.0% to 11.4% (or higher) above its 50 EMA
* The last closing price is 1.15% away from its 50 EMA
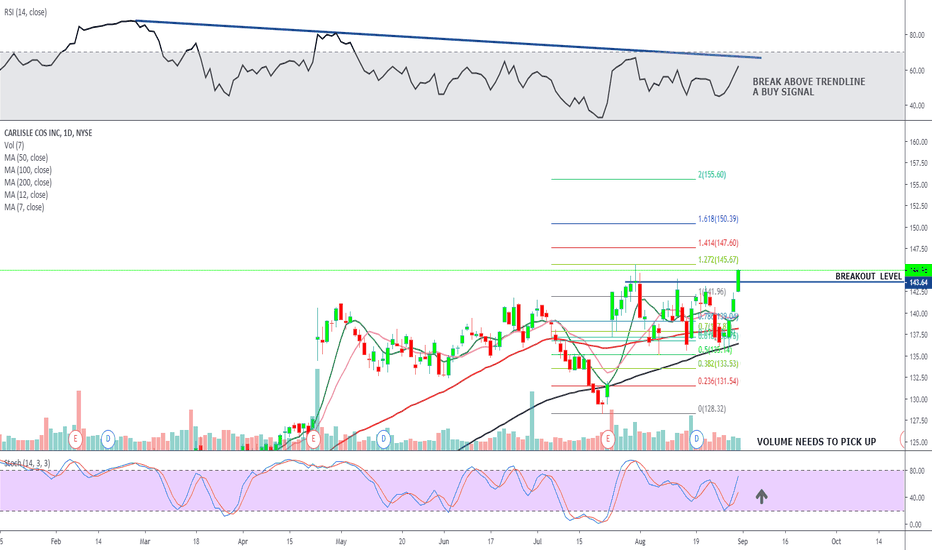
Breakout in Carlisle Cos. AVERAGE ANALYSTS PRICE TARGET $151
AVERAGE ANALYSTS RECOMMENDATION OVERWEIGHT
P/E RATIO 20
SHORT INTEREST 4.25%
COMPANY PROFILE
Carlisle Cos., Inc. engages in the manufacture and distribution of engineered products for both original equipment and aftermarket channels. It operates through the following segments: Carlisle Construction Materials, Carlisle Interconnect Technologies, Carlisle Interconnect Technologies, Carlisle Fluid Technologies, and Carlisle Brake & Friction. The Carlisle Construction Materials segment includes the manufacture of insulation materials, rubber, thermoplastic polyolefin, and polyvinyl chloride roofing membranes; related roofing accessories; and waterproofing products. The Carlisle Interconnect Technologies segment focuses on the design and manufacture of wire, cable, connectors, contacts and cable assemblies for the transfer of power and data. The Carlisle Fluid Technologies segment deals with industrial liquid and powder finishing equipment and integrated system solutions for spraying, pumping, mixing, metering and curing of a variety of coatings. The Carlisle Brake and Friction segment covers brakes and friction material and clutch and transmission friction material. The company was founded by Charles S. Moomy in 1917 and is headquartered in Scottsdale, AZ.
Short Play on 9 in 9 for CSLNYSE:CSL came across our 9 in 9 scanners past 2 days (Daily 9 inside Weekly 9) and seems like interesting short opportunity.
Spitballing here...but for advanced TDreasons that I don't wish to dig into here price should target the pink line on the weekly chart shown (low of candle 6 aka Swing Low). Priced bounced from there directly into a perfected Sell Setup 9 on daily.
So our Weekly is is bearish (not the type of Buy Setup 9 that you're looking to buy) and should target pink line, our Monthly is bearish (bullish count broke 1.5 months ago), and our Daily 9 just provided us a perfected sell set up into some resistance.
Short recommended with pink line as first target (will target more if daily count is fresh...will for sure close if a buy set Up 9 comes before the 6 low aka Swing Low).
Daily Chart with same pink target:


