HOUSING MARKET BOTTOM? I think so, such a beautiful chart. I noticed Reits having their largest trades EVER in the darkpools yesterday. This is a beautiful chart of Cubesmart and look at it. Housing broke resistance from 2007 in April and has now comeback to test it in Sept-Dec all while institutations are putting out paid ads to spread the doom and gloom. Everyone and their mother is repeating the housing shock. Well if this support holds which I think it will we're in for another housing boom until we get another blowoff top. Everything here just lines up so well for a market bottom in general, I think the markets as a whole should rise for at least a couple years.
CUBE trade ideas

$CUBE with a Bearish outlook following its earnings #Stocks The PEAD projected a Bearish outlook for $CUBE after a Negative Under reaction following its earnings release placing the stock in drift D with an expected accuracy of 40%.

$CUBE with a Neutral outlook following its earnings #Stocks The PEAD projected a Neutral outlook for $CUBE after a Positive Under reaction following its earnings release placing the stock in drift A with an expected accuracy of 77.78%.

28/3/2022 NYSE (CUBE)Buy (Entry Price) within the buy zone area and exit (Stop Loss) below the red line. Can take profit at the suggested Target Price.
Entry Price: $50.80 / $50.46
Target Price: $51.37/ $50.94
Stop Loss: $49.66

CubeSmart $CUBE breakouts after VCPCubeSmart is a real estate investment trust that invests in self storage facilities. It rents spaces for individuals and businesses of all kind.
Since september the price its been forming a volatility contraction pattern (VCP) with a footprint of 13W - 13/4 - 4T. Today made the breakout with good volume and high close. But, as the market hasn't been respecting breakouts, I started small by buying just 1/3 of my position sizing. If the stock follows through, I'll add to my position.
NYSE:CUBE respects my trend template, confirmed by IBD with a 92 relative strength rating. Is also respecting the Code 33: three quarters of accelerating earnings, sales and profit margins.


Bullish moveBullish move break of trendline looking for increase volume to add on.
stoploss $54
Target 20%
For entertainment purposes. Please use proper risk management

consolidation faze here ✅I'd wait until we test 53s if looking for a long entry on CUBE, its a very slow mover with tons of traps though. chances are we continue sideways in this range for a while.
like and follow for more 💘
VCP in a weekly baseWhile not growth, this stock has been setting up nicely on the weekly charts and showing a VCP on the daily... a nice trade with less than 6% risk

CUBE - Quick dated Review of price actionCUBE - All Time High @56.53 on November 3, 2021 with significant pull backs on 10/5 and 11/17. She reached resistance on September 8, 2021. It is currently a resistance zone consolidating.

CUBE ready to move higher?* Great earnings
* Very strong up trend
* High 3-month relative strength in the Real Estate sector
* Breaking out of a ~2 month base forming a cup and handle
* Breaking out with higher than average volume
Trade Idea:
* Now's a great time to enter as the price is very close to the broken level
* Looking at the weekly chart, it seems like this is ready to move now.
Caution:
* Consider exiting the trade if it makes a daily close below $54.56 and makes lower lows for 3 consecutive days

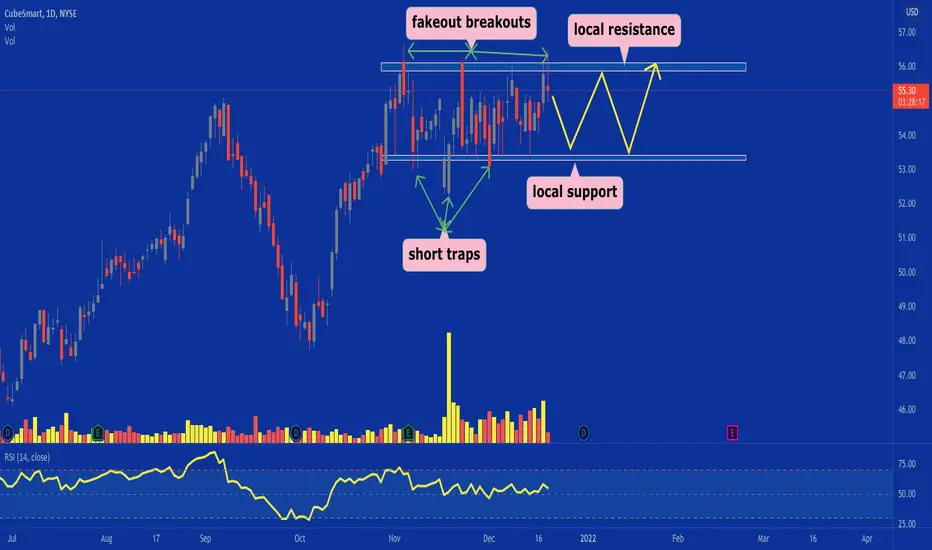
(US) CUBESMART VCPCUBESMART experience 2 fake breakout that follow with a contraction.
Sky rocket volume then came in 17 Nov and experience another contraction.
C1: -13%
C2: -6% (after fake breakout)
C3: -4% (after fake breakout again)
Price recover at pivot area. Awaiting another breakout attempt! Will this round successful? Let's monitor.
Disclaimer:
Not a buy call recommendation, sharing based on my personal experience in technical analysis and chart pattern. Trade at your own risk.

$CUBE BULLISH- Ascending Channel
- Price is above the 200 EMA , 100 EMA , 50 EMA , 20 EMA and 10 EMA
- ADX above 25


CUBE Swing Trade IdeaCubeSmart operates as a self-managed and self-administered real estate company. The Company focuses on the ownership, operation, management, acquisition and development of self-storage properties in the United States. Its self-storage properties are designed to offer storage space for its residential and commercial customers. Its storage facilities offer lockers, mini storage units and large 10 feet x 30 feet storage rooms. The Company offers various storage options, including household and personal storage, business storage, vehicle and car storage, recreational vehicle (RV) storage, boat storage, motorcycle storage, moving storage and military storage. It also offers CubeSmart Services. As of December 31, 2016, the Company owned 475 self-storage properties located in 23 states and in the District of Columbia. In addition, as of December 31, 2016, it had managed 316 stores for third parties. Its self-storage properties are located in metropolitan areas, as well as suburban areas.


CUBESMART Opportunity Hello traders, CUBESMART is in a bullish configuration with a hammer candle low buying volume and the previous session we have a large buying volume despite all these signs. It still wants to go upwards with a strong potential to move up the equilibrium zone under construction to go towards the next high point.
If the buyers push, we can breakout once and manage to fill the bullish gap, we are on the next low after seeing in the decision area that follows.
Please LIKE & FOLLOW, thank you!

REIT StrengthStorage REITs remain the most attractive within Real Estate.
CUBE in particular is displaying a strong amount of relative strength.

CUBE LongOne of my reversal strategies. Average win Rate 50 - 80%.
Long 30.28
Stop Loss 29.59
Profit target 31.40

Stock Reversal (1 - 2 week target)Short term reversal. CUBE has reached support level to quickly make a reversal to upside.

Absolutely Amazing For Current Conditions!Look at the recent growth here! Today is a massive selloff on Wall St and yet...well you see it with your own eyes. Watch the RSI because it is trending toward over bought, but when they get to highs like this they always are.
"Fundamental factors:
Market Cap $6.28 billion
P/E 20.04
Dividend yield 3.84%
Revenue expected to grow 5.70% this year and another 3.50% next year
Earnings estimated to decrease 3.60% this year but increase again by 5.00% next year and continue to compound at an annual rate of 6.00% for the next 5 years
Wall Street analysts issued 2 strong buy, 3 buy, 8 hold and 1 under perform recommendation on the stock
The individual investors following the stock on Motley Fool voted 31 to 4 that the stock will beat the market
4,888 investors are following the stock on Seeking Alpha" (Barchart) <-------- Good source to find these great looking stocks, just get their "Chart of the day" e-mailed to you daily. That's 5 easy trades or investments worth looking into that fall into your lap every week for FREE - I love that word :)

CUBE, breakout 32.5CUBE - of the financial sector
long over 32.5 which currently represents a resistance level
Support level: 31.5
First target would be: 33.3
OBV and MacD support the idea.
Planing an entry over 32.5 after an approval candle and follow-up of trading volumes.
this is not a recommendation (-:
as always, feedback is welcome

