Carvana Co. stock forum
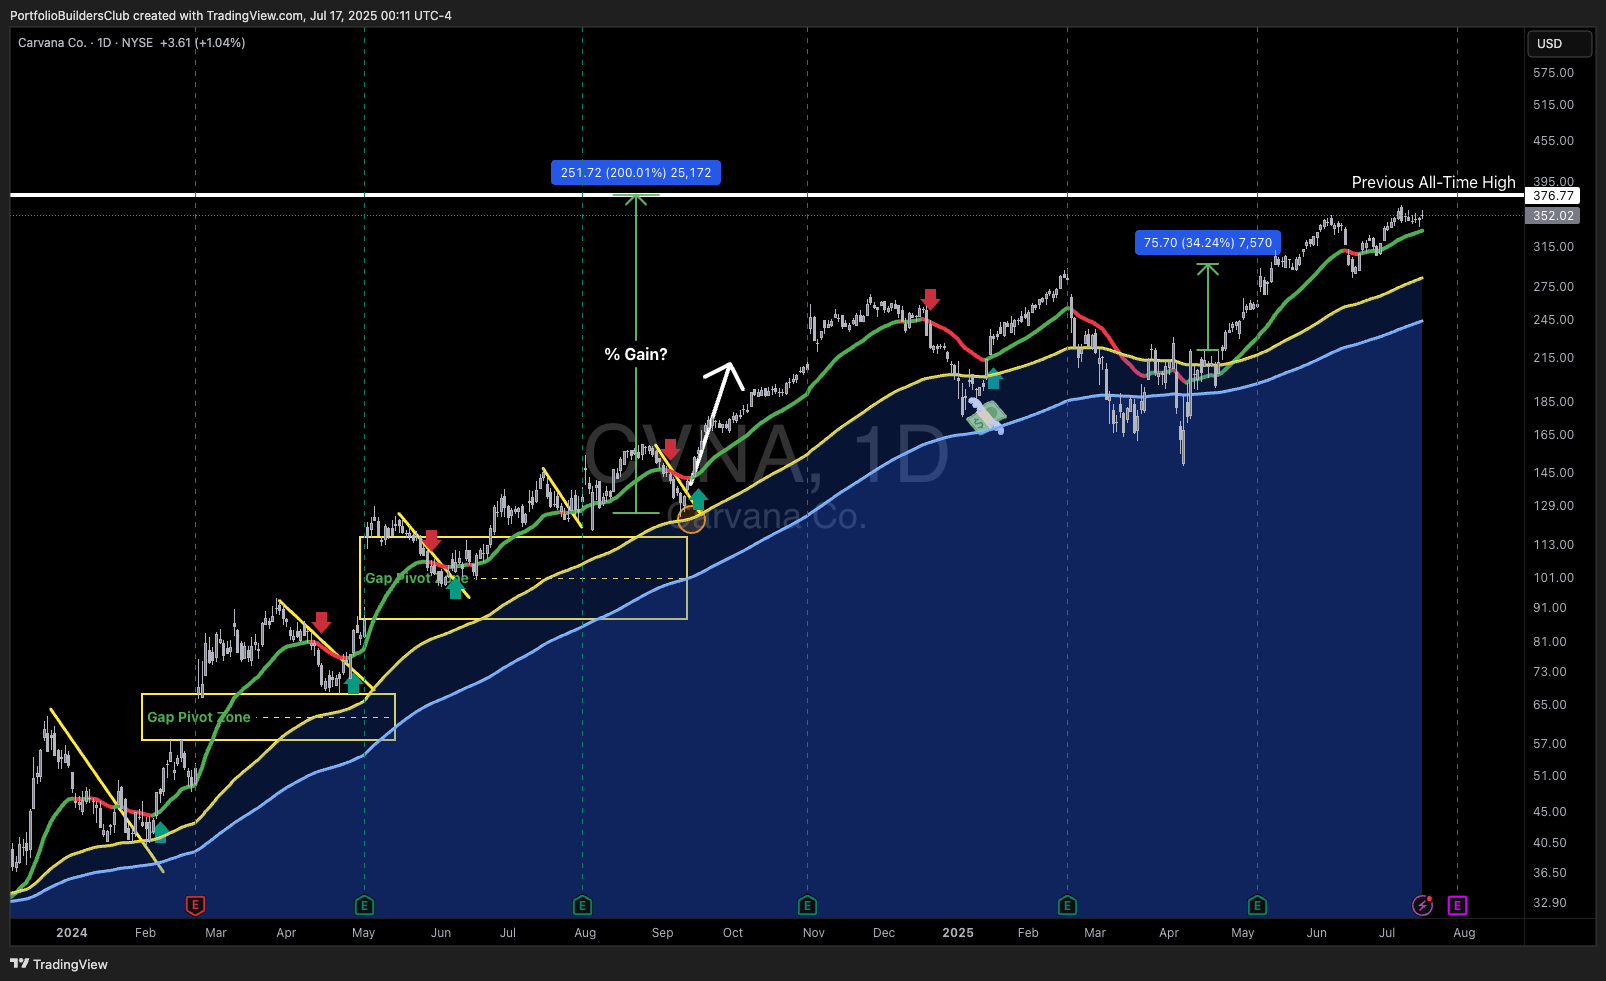
Price gapped into the macro resistance zone that has been outlined since my initial coverage of the trend structure in late May.
At this stage, I expect price to start forming a top for the uptrend that began at the April bottom. Ideally, price consolidates within the 425–435 extension zone. However, if the bullish momentum remains strong, a further extension toward 480 is still possible.
Chart:
tradingview.com/x/hEozxuvV/
Previously shared updates:
• On more upside potential (Jul 21):
tradingview.com/symbols/NYSE-CVNA/minds/?mind=XzEJB6tOSYuw2Mh2BA-5Ng
• On constructive bounce (Jul 2):
tradingview.com/symbols/NYSE-CVNA/minds/?mind=BHPi5jBBTSW-jJaWMdLsFQ
• On pullback to mid-term support (Jun 11):
tradingview.com/symbols/NYSE-CVNA/minds/?mind=B87Y42qyT7CsqDlR_TlrMg
• On potential upside toward Aug ’21 ATH (May 25):
tradingview.com/symbols/NYSE-CVNA/minds/?mind=rpDpgJvATB2r7gV9jrgFSQ

Chart:
tradingview.com/symbols/NYSE-CVNA/minds/?mind=BHPi5jBBTSW-jJaWMdLsFQ
Previous coverage:
On upside to Aug ’21 ATH (May 25): tradingview.com/symbols/NYSE-CVNA/minds/?mind=rpDpgJvATB2r7gV9jrgFSQ
On pullback to mid-term support (Jun 11): tradingview.com/symbols/NYSE-CVNA/minds/?mind=B87Y42qyT7CsqDlR_TlrMg
On constructive bounce (Jul 2): tradingview.com/symbols/NYSE-CVNA/minds/?mind=BHPi5jBBTSW-jJaWMdLsFQ
Manufacturing good looking headline numbers that aren't in line with the rest of the company when considered holistically seems to be part and parcel of modern scam companys. There are many of them doing it these days because it seems retail traders aren't sophisticated enough to look deeper than the headline numbers that appear on the surface. This company looks absolutely terrible when you actually look into it and ask simply questions like the nature of their drivetime loan repurchase agreements or thier profitably and debt load.
The thing is there simply isn't the liquidity in the market to absorb all the long's shares, so if they allow this to correct it's going to crash hard, which is why they don't. It's kind of funny how people don't seem to realize there are big money players looking at the technicals in this and many other things, who are manufacturing signals to take advantage of people using technical analysis.
Now, I won’t count out the possibility of this pattern failing- resulting in an explosive move upward. People shorting can catch the completion of the head down to the neckline,which is about $285-$292 zone. Get out before the right shoulder starts to take off, or worse, fails to complete. Go short once the right shoulder completes and price breaks below the neckline.