CVX Trade Setup — Catch the Bounce + Dividend PlayChevron ( NYSE:CVX ) is setting up for a potential bounce from strong support around $134.96 (S2 level). The trade aligns with both technical and fundamental tailwinds:
🟢 Technical Setup:
Holding just above S2, showing signs of base formation.
Clear risk/reward box:
Entry: ~$135
Target: $150.05 → ~+10.5%
Stop: $133.73 → ~-2.4%
R:R Ratio: ~4.6:1
MACD histogram flipping positive.
RSI rebounded from oversold and consolidating.
💰 Dividend Catalyst:
Ex-div date: May 19
Yield: 5.04% (quarterly payout of $1.71/share)
Chevron has increased its dividend for 37 consecutive years — strong income + growth combo.
This is a solid swing + yield capture setup. I’m long from $135.64.
📈 Watching for confirmation over $137 before scaling.
Do you think CVX hits $150 before ex-div? Drop your chart 👇
CVX trade ideas

CVX – Waiting for Pullback to 0.382 Before Targeting Gap FillsChevron (CVX) recently broke structure to the upside after holding a 1D demand zone near $136.
I'm now watching for a pullback toward the 0.382 retracement (~$141.80) of the recent impulse. This level aligns with the breakout area and offers a potential continuation setup.
🎯 Trade Setup:
Bias: Long (on retracement)
Entry zone: $141.80 – $142.00
Targets:
📌 Gap 1 → ~$158
📌 Gap 2 → ~$166
Invalidation: Close below $138 would negate the bullish thesis.
🧠 Context:
Structure flipped bullish after BoS.
Gaps above remain unfilled, acting as magnet zones.
Pullback to 0.382 = logical spot to join trend continuation.

Bullish Outlook: Key Levels Signal Upside PotentialTargets:
- T1 = $140.50
- T2 = $144.00
Stop Levels:
- S1 = $134.50
- S2 = $133.00
**Wisdom of Professional Traders:**
This analysis synthesizes insights from thousands of professional traders and market experts, leveraging collective intelligence to identify high-probability trade setups. The wisdom of crowds principle suggests that aggregated market perspectives from experienced professionals often outperform individual forecasts, reducing cognitive biases and highlighting consensus opportunities in Chevron.
**Key Insights:**
Chevron's strong fundamentals and diversified portfolio provide a solid foundation amid fluctuating oil prices. Technical indicators show pivotal price levels forming, with potential upside supported by favorable global energy trends. Chevron has demonstrated resilience in managing legal uncertainties, keeping investor focus primarily on its operational strength and robust cash flow generation.
The company’s strategic push into renewables and low-carbon technologies complements its legacy oil and gas portfolio. This dual approach positions Chevron for both short-term performance in traditional energy markets and long-term sustainability amid global energy transitions.
**Recent Performance:**
Chevron has recently exhibited a steady consolidation near its current price level, reflecting broader market trends within the energy sector. The price movement has remained moderately volatile, with external events such as crude oil pricing and geopolitical dynamics heavily influencing its trajectory. The stock held its ground despite industry-wide challenges, showcasing its stability compared to several competitors.
**Expert Analysis:**
Market analysts are optimistic about Chevron’s ability to maintain growth through its strategic investments and operational efficiency. Technical sentiment reveals the stock is hovering around a crucial accumulation phase, suggesting higher probability for breakout scenarios. Current volumes and price actions indicate renewed investor interest, particularly as macroeconomic conditions favor energy demand.
Experts highlight Chevron’s ability to leverage its global operational footprint to mitigate risks associated with regional disruptions or commodity supply challenges. While the lawsuit against major oil companies introduces some uncertainty, Chevron’s financial health and legal expertise are expected to navigate this risk effectively.
**News Impact:**
Recent developments around rising oil prices due to supply chain constraints and geopolitical tensions remain the key market drivers for Chevron. Additionally, the ongoing legal challenges faced by top industry players, including Chevron, have slightly weighed on investor sentiment. However, these issues are manageable considering Chevron’s reputation for operational resilience and strategic focus. Positive developments in the renewable energy narrative could further boost the market outlook for Chevron.
**Trading Recommendation:**
Based on technical analysis and expert opinions, traders should consider taking a bullish position on Chevron at its current price level of $136.70. The stock's recent consolidation and key support levels provide an attractive entry point for upside gains. Favorable macroeconomic conditions and the company’s proven track record in navigating industry challenges further reinforce the likelihood of price appreciation toward the $140.50 and $144.00 levels. Setting tight stop-loss levels at $134.50 and $133.00 ensures adequate risk management while capitalizing on potential momentum-driven price movements.

Chevron wedge bull flagChevron stock is well below its intrinsic value, I found a decent setup based on technical analysis for my entry, because of the attractive dividend payouts I will buy and hold CVX for awhile and see what happens.

Quick View: $CVX(1 hour) Consolidation with Bullish EMAs
(weekly), good action above the ema 50
Watching $144 as key resistance.
Support → $139/$133

CVX demand zone!OptionsMastery:
🔉Sound on!🔉
📣Make sure to watch fullscreen!📣
Thank you as always for watching my videos. I hope that you learned something very educational! Please feel free to like, share, and comment on this post. Remember only risk what you are willing to lose. Trading is very risky but it can change your life!

Chevron: The Chart’s Reaching a Critical PointChevron is starting to look very interesting again — but let’s be clear from the start: Chevron, like every oil giant, lives and dies by the price of oil. If oil rips higher or collapses due to global politics, supply shocks, or economic chaos, Chevron NYSE:CVX follows. No exceptions.
That said, what we’re seeing on the chart right now is increasingly pointing toward a deeper correction — specifically down to the $113–$100 zone. That would make sense structurally as a Wave 4 retracement.
But there’s a technical nuance here. Wave 1’s high sits at $103 — and depending on how strict your Elliott Wave rules are, Wave 4 dipping into Wave 1 is bad territory. Personally, I’m okay with a brief touch into that range, but I don’t want to see price hanging around below $103 for long.
From a trend perspective, we’re clearly in a downward channel. We just saw a textbook bull trap:
Chevron broke out with a solid +7% move over two weeks,
Followed immediately by a massive 22% drop,
One of the sharpest two-week declines since — yeah — March 2020, pandemic levels.
Now, price is hovering around $130, and the setup is simple:
If this level holds, great — maybe we’re bottoming.
If it breaks, I’m looking to buy between $113 and $100. That’s where the structure aligns, the volume kicks in, and risk/reward starts to make sense again.
So here’s the real question:
Do we see $200 first — or $100?
I’m leaning $100 first.
Not because I’m bearish long-term— but because that level would clean up the chart, shake out the noise, and give us a real shot at riding the next strong leg higher with conviction.
Would love to hear what you think — where’s your bet?

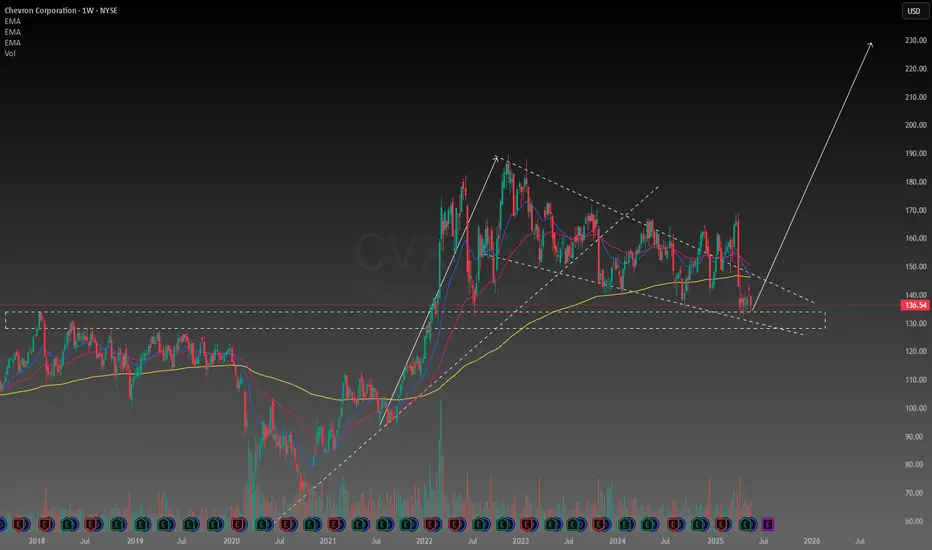
CVX - Similar Structures Similar structures along bullish trend line up on this Weekly chart
Due to the similarities i think the bulls can continue upwards along this trend line in green
Bullish on Weekly

Understanding How to Trade With HFTsHigh Frequency Trading Firms provide liquidity to the public stock exchanges and have been around for more than 20 years. HFTs are called "maker/takers" as the make liquidity by selling shares of stock when there is a high number of buyers but fewer sellers. They take the market and sell short to provide the buy to cover to fill the orders during a panic selling by retail groups and smaller funds managers. HFTs are here to stay and are a necessary market participant in the millisecond transaction professional side of the market. HFTs have 6 primary strategies that create extremely complex algorithms for each of these strategies. HFT programmers and Quants who design these algos are constantly tweaking and improving the algo to trigger precisely as needed.
This creates a highly liquid market open but the rest of the day the stock may have much lower liquidity. Volume Bars indicate high or low liquidity intraday. HFTs Artificial Intelligence is still very new and the AI makes many mistakes. Last earnings season there were stocks that gapped down on GOOD earnings news. This is likely to occur again as AI with HFT algos is still being developed.
HFTs also search for anomalies in order flow which is when a group of retail traders get together and all try to trade the same stock at the same time to create huge momentum intraday. This usually happens around the 3 hour lunch time of the US so between 11- 1pm. HFTs can see these cluster orders and can fill the ques in opposition to the groups intent.
This is just one example of how you may be accidentally trading against an HFT and the HFT is going to win. It has far more money to trade than you do. So be aware of this. You want to be with the HFTs not trading in opposition.

CVX eyes on $146: Proven Resistance to stop bounce or Break?CVX got a Tariff Relief bounce into resistance.
Look for a dip or break and retest for long entry.
Or if Oil keeps getting spilled then short here.
$ 145.89-146.28 is the exact zone of interest.
$ 153.55-153.88 above is quite achievable.
$ 127.32-128.04 below a good shorting target.
==========================================

Chevron (CVX) – Strong Growth & Cash Flow ExpansionCompany Overview:
Chevron NYSE:CVX continues to demonstrate strong operational efficiency, strategic expansion, and record-breaking U.S. production.
Key Catalysts:
Production Growth & Profitability 🚀
Global production up 7% in 2024.
U.S. output surged 19% to record levels.
Permian Basin nearing 1M bpd, reinforcing cash flow strength.
Strategic Expansion & Sustainability 🌍
Gulf of Mexico projects targeting a boost from 200K to 300K bpd.
Future Growth Project in Kazakhstan enhances long-term production & ESG alignment.
Navigating Venezuelan challenges while leveraging stable U.S. policies for continued growth.
Investment Outlook:
Bullish Case: We remain bullish on CVX above $139.00-$140.00, backed by resilient production growth & execution.
Upside Potential: Our price target is $215.00-$220.00, supported by strong cash flow & expansion initiatives.
🔥 Chevron – Powering the Future with Growth & Stability. #CVX #EnergyStocks #OilAndGas

Is Chevron Attempting a Breakout?Chevron has gone nowhere for more than a year, but some traders may think that’s changing.
The first pattern on today’s chart is the $162.30 level, the highest weekly close since last May. The energy giant challenged that resistance a few times without success -- but yesterday may have broken it decisively.
CVX also apparently escaped a falling trendline that began in September 2023.
Next, you have the series of lower weekly lows, followed by higher weekly lows (marked with yellow arrows). That may be viewed as a long-term basing pattern.
Last, the 100-day simple moving average (SMA) recently crossed above the 200-day SMA. The 50-day SMA crossed above both. Such an alignment, with faster SMAs above slower ones, may be consistent with a longer-term uptrend.
TradeStation has, for decades, advanced the trading industry, providing access to stocks, options and futures. If you're born to trade, we could be for you. See our Overview for more.
Past performance, whether actual or indicated by historical tests of strategies, is no guarantee of future performance or success. There is a possibility that you may sustain a loss equal to or greater than your entire investment regardless of which asset class you trade (equities, options or futures); therefore, you should not invest or risk money that you cannot afford to lose. Online trading is not suitable for all investors. View the document titled Characteristics and Risks of Standardized Options at www.TradeStation.com . Before trading any asset class, customers must read the relevant risk disclosure statements on www.TradeStation.com . System access and trade placement and execution may be delayed or fail due to market volatility and volume, quote delays, system and software errors, Internet traffic, outages and other factors.
Securities and futures trading is offered to self-directed customers by TradeStation Securities, Inc., a broker-dealer registered with the Securities and Exchange Commission and a futures commission merchant licensed with the Commodity Futures Trading Commission). TradeStation Securities is a member of the Financial Industry Regulatory Authority, the National Futures Association, and a number of exchanges.
TradeStation Securities, Inc. and TradeStation Technologies, Inc. are each wholly owned subsidiaries of TradeStation Group, Inc., both operating, and providing products and services, under the TradeStation brand and trademark. When applying for, or purchasing, accounts, subscriptions, products and services, it is important that you know which company you will be dealing with. Visit www.TradeStation.com for further important information explaining what this means.

The #1 Secret To Trading Stocks How To Trade Safely
--
Early in the morning I was scanning for the best stock to buy.Checking different time frames.
You need to read my story because at the end of this story am going to share with you the 👉#1 Secret To Trading Stocks👈
I refuse to give up on finding the best strategy to trade stocks because it's possible.
So what hoped on TradingView scanning for the best stocks, and this platform helped me a lot.
But I met with a challenge.There are too many trading time frames.
Listen the worst thing you can do is slip down into a gambling mode.Thats hell fire 🔥 you will lose all your money.
Trading is not easy at all the challenges are:
-1- Gambling
-2- Too Much Leverage
-3- Not Having A Strategy
Maybe you have fallen in love with your broker technology platform with the colors and buttons.
Don't fall for that crap!! Those colors are a tempting offer to gamble your hard earned money.Remember stick to a strategy.
What did you learn from me? I taught you the "Rocket Booster Strategy"
Find peace with this strategy because
It's the 👉#1 Secret To Trading Stocks👈
It has 3 Steps:
1)The price should be above the 50 EMA
2)The price should be above the 200 EMA
3)The price should Gap up above the moving averages on All Time Frames
That's the key.Also remember don't use more than x5 margin.Dont gamble using "50x" or "10x" no don't!
The key is to stay within 2x -5x margin levels using the Rocket Booster Strategy.
This strategy will save you during your trading journey especially when you buy NYSE:CVX
Return to the rocket booster strategy I know you think your strategy will work better if you "10x".
Listen do you want to gamble and lose everything or use a strategy for trading as a business and investment?
The freedom is in you using a strategy.Because trading is a business and investment.
Rocket boost this content to learn more.
Disclaimer ⚠️ Trading is risky please learn risk management and profit taking strategies.Also feel free to use a simulation trading account before you use real money.

bullflag with rsiBMV:CVX
ive detected a bullflag on a day chart for chevron. today we get approval or not at midnight for the government to be funded lol might or might not help this. #testing

AB=CD on Chevron. CVXEarly bounce off support now, full steam ahead to the upside , crossing vWAP and US in the second last candle. Now MIDAS crossed. Below oscillators have or are about to turn bullish, reflective of the upgoing candlesticks. This is an AB=CD as far as I'm concerned and Kennedy channeling for stationary goals in any parallelogram structure applies.

What Lies Beneath Chevron's Venezuelan Exit?In a striking geopolitical maneuver, the Trump administration has revoked Chevron's license to operate in Venezuela, effective March 1. This decision marks a sharp departure from the Biden-era policy, which had conditionally allowed Chevron’s operations to encourage free elections in the beleaguered nation. Beyond punishing Venezuela for unmet democratic benchmarks, the move reflects a broader U.S. strategy to bolster domestic oil production and lessen dependence on foreign energy sources. Chevron, a titan with over a century of history in Venezuela, now faces the unraveling of a vital revenue stream, prompting us to ponder the delicate dance between corporate ambition and national agendas.
The ripple effects for Venezuela are profound and perilous. Chevron accounted for nearly a quarter of the country’s oil production, and its exit is forecast to slash Venezuela’s revenue by $4 billion by 2026. This economic blow threatens to rekindle inflation and destabilize a nation already teetering on the edge of recovery, exposing the intricate ties between U.S. corporate presence and sanctioned states. For Chevron, the revocation transforms a once-lucrative asset into a geopolitical liability, thrusting the company into a high-stakes test of resilience. This clash of interests challenges us to consider the true cost of operating in the shadow of political volatility.
On the global stage, this decision reverberates through energy markets and diplomatic corridors. Oil prices have already twitched in response, hinting at tighter supplies. At the same time, the fate of other foreign firms in Venezuela hangs in the balance, shadowed by the looming threat of secondary sanctions. As the U.S. sharpens its confrontational edge, the energy landscape braces for transformation, with consequences for geopolitical alliances and energy security worldwide. Is Chevron’s departure merely a pawn in a broader strategic game, or does it herald a seismic shift in global power dynamics? The answer may redefine the boundaries of energy and influence in the years ahead.


How to find Sell Side Institution Trading ActivitySell Side Institutions are a major market participant. They are often called "Wall Street"
These giant banks and financial services companies do a variety of trading activities. They move price in an entirely different way than the Buy Side Institutions.
Sell Side Institutions have specific services they provide to the stock market including Market Making when there is a void of buyers. Sell Side make the market by selling short before market opens when the overall market has more retail sellers than buyers.
Sell Side also does all the buybacks for major corporations. Sell Side also are strictly short term trading trading a variety styles and strategies throughout the day. Sell Side has the best of the best floor traders who are the most experienced and savvy traders in the world.
Join this discussion to find you how you can learn to trade with the Sell Side and what indicators to use in your Tradingview software.

Long CvxStrong months ahead for Cvx. Mr. Buffet has generated investments in the company and under chart analysis we see a continuation of the major uptrend.
Cheers

Energy Drives Innovationschevron was at the White House - 8,000 employee cut ( estimated 75k a year lets say = $600m instant saving a year)
best of luck.

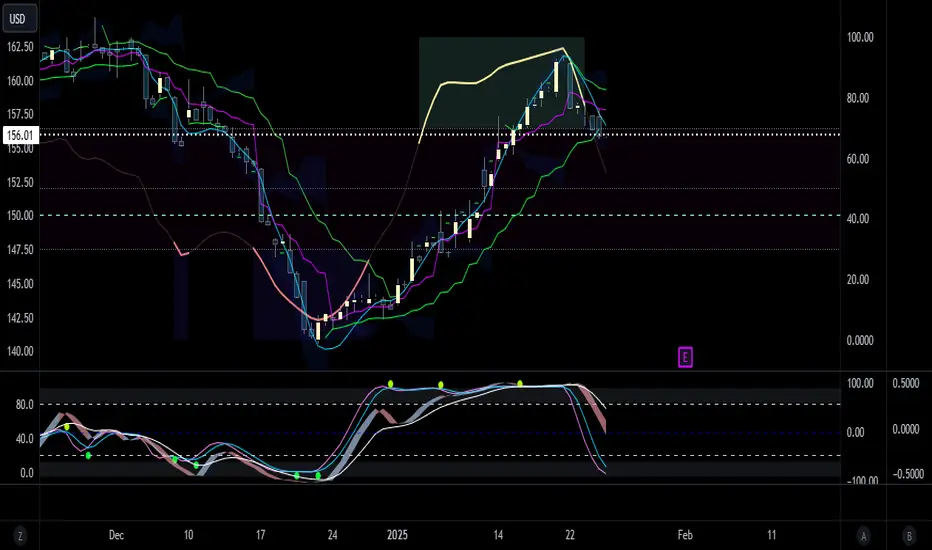
CVX on the Radar! Carefully Picked for a High-Conviction Trade!Market Structure Overview:
* CVX is currently trading in an ascending channel, showing higher highs and higher lows—a sign of bullish momentum.
* The stock recently hit a high of $158.71 and is now pulling back slightly, testing support near $155.77 - $155.23.
* A breakdown below $155.23 could lead to further selling pressure toward the next support at $151.06.
Key Support & Resistance Levels:
* Resistance:
* $158.71 (Recent High)
* $160+ (Potential breakout target if momentum continues)
* Support:
* $155.77 - $155.23 (Current support zone within the trend)
* $151.06 (Major breakdown level)
Indicators Analysis:
* MACD:
* The MACD is showing signs of weakness as the histogram is declining. This suggests momentum may be cooling off.
* A bearish crossover on the MACD lines would further confirm short-term downside risk.
* Stochastic RSI:
* The Stoch RSI is at the bottom, indicating that the stock may be oversold in the short term and could soon see a bounce.
* If it curls back up, it could provide a bullish entry signal.
Price Action Insights:
* The stock has been following an uptrend, but a short-term pullback is developing.
* A break above $158.71 could send CVX to $160+, while a failure to hold $155.23 could lead to a deeper pullback toward $151.06.
* Volume is relatively stable, but a spike in either direction would confirm the next move.
Trade Scenarios:
✅ Bullish Setup:
* Entry: Near $155.50 - $156.00 (If support holds)
* Target: $158.71 → $160
* Stop Loss: Below $154.50 (Break of trend)
❌ Bearish Setup:
* Entry: If price breaks below $155 with high volume
* Target: $151.06
* Stop Loss: Above $157
Final Thoughts:
* CVX is bullish but showing short-term weakness.
* Watch the $155.23 level for a bounce or breakdown.
* A break above $158.71 could trigger a strong upside continuation.
🚀 CVX is in an uptrend, but watch for potential pullbacks before entering new trades!
📌 Disclaimer: This analysis is for educational purposes only and is not financial advice. Always do your own research and risk management before trading.

Chevron Heading Underground. CVXA bearish outlook on this situation from a purely technical standpoint. The amalgamation of factors make for a convincing picture. There is a break of MIDAS line, price action cross of US and vWAP line, cross of US/vWAP lines, negative volatility zone oscillations, negative stochastics, trigger cross of downgoing vzo ribbon. And to top it off, exit out of the OBOS territory by the momentum indicator. Good luck out there!