NYSE:DT (Dynatrace) local stop on its way to 60$+Since April 2025, Dynatrace has established a local uptrend. Based on the daily chart, the recent drop below $53 appears to have fulfilled one of the likely targets for wave iv. This may represent wave iv of a five-wave impulse originating from the April low. If correct, wave v is expected to push above the high of wave iii.
There are two potential trade setups:
Trade 1: Entry at the current price (~$53.00), with a stop-loss at $52.34.
Trade 2: Entry at $51.54, with a final stop-loss at $48.89. This entry level is supported by a price gap and Fibonacci retracement zone, making it technically stronger.
In both cases, the initial target is $57.55. A potential resistance zone lies above $60.70, based on prior selling activity.
DT trade ideas

1/3/25 - $dt - want to own, but can't near $55. patience or pass1/3/25 :: VROCKSTAR :: NYSE:DT
want to own, but can't near $55... patience or pass
- solid B2B analytics biz w healthy mgns, solid growth and cash gen
- wrote about it in may '24 and only traded the Q for a quick in-out, didn't return to the scene of the crime at $40 (that's why it's important to set your alarms in trading view! as many as you can handle! and update them if/when triggered)
- at this stage in the bull, we're a bit long in the tooth and for cheaper multiples and CF generation, again, sounding like i'm beating ol' charlie horse... NYSE:TSM and NASDAQ:NVDA are simply better tech owns (moat + valuation + visibility).
- but with that being said, i'd like to begin re-building my cyber security/ analytics portfolio this year and so fare it's quite tip-toe-ish... as i trade around small sizes in a few names here/ there. for the past few days i'm only messing w NYSE:S and NASDAQ:OKTA , but again, they're not super obvious when compared to the big names above (and my fav name $NXT... go read that - again diff industry, tho).
- back to $DT. i've made some notes for myself on the chart. do we fill the gap near $40 if/when we puke-a-do-dah beta-risk-off "china bombed taiwan... oh wait, lol, that didn't happen"... could be. or "bird flu get ur bird flu" risk off? could be. idk what the controllers have in store for us, but if it's a pan sell off and this thing wicks... or has a mediocre growth Q and stonk -15-20%... it's defn a buy. stock already a buy on a multi-year horizon, just not great value.
- next trigger for me is a hair above $50 to re-evaluate and i'd prefer mid 40s and ideally to fill that low 40s gap where we can ride w/ good mgn of safety.
V

Earnings Soon w/ Good Growth and Weird VolumeWe should be movement to the upper channel on good earnings.
Okay growth
Strong Sector
High demand and low supply

Dynatrace, Inc.
The most recent candle shows a bullish movement with a gain of +1.60%.
The Bollinger Bands show increasing volatility in recent days. The upper and lower bands are diverging, suggesting that price movements might become more extreme in the short term.
There has been a spike in volume, with higher-than-average activity. Increased volume often signifies a stronger commitment to the direction of the price movement, in this case, bullish.
This volume surge could be supporting the recent price breakout above resistance levels.
Immediate resistance seems to be near $52.00 (just above the current price), with the next key level around $54.00 based on previous highs in April-May.
Support lies around $50.00, with stronger support around $46.00-$48.00 where the price consolidated earlier.
Short-term trend is bullish, with price holding above the middle Bollinger Band and recent higher highs being formed.
There's a potential for a continuation if the price can maintain momentum and break through the $52.00 resistance level.
Bullish Case: If the price continues to rise, breaking through $52.00, it could target $54.00 and higher levels, especially if supported by strong volume.
Bearish Case: A pullback might occur if the price faces resistance at $52.00 or if the Bollinger Bands begin to contract. In that case, the price could test the middle band (around $48.00-$50.00) for support.

DT long to $58-59This was another pendulum pick from last Sunday that I wasn't sure I was supposed to work on yet, but I see it's moved and I got a quick read of it as quite bullish.
I expect it could get to $58-59 pretty quickly. It may go further than that, but I'll wait till it gets up there and check on it again.

Dynatrace joins AWS Application Migration Service as a partnerDynatrace Inc., a leading provider of enterprise IT infrastructure monitoring and performance tools, has been named the first partner of the AWS Application Migration Service partner program. This partnership is part of a significant Amazon initiative designed to streamline the process for customers looking to transition their applications to the cloud. As a participant in this program, Dynatrace is set to benefit from an influx of new customers migrating to AWS.
This collaboration allows AWS customers to integrate Dynatrace’s monitoring platform during their cloud migration seamlessly. Consequently, users gain immediate access to essential tools for optimising the performance of their new IT infrastructure. This strategic alignment not only enhances the cloud migration experience for AWS customers but also positions Dynatrace to tap into the growing demand for cloud services.
Technical analysis of Dynatrace Inc. (NYSE: DT)
Let’s examine the stock chart of Dynatrace for potential trading opportunities:
Timeframe: Daily (D1)
Current trend: there is an ongoing downtrend; however, a recent break above the resistance line suggests potential for reversal
Resistance level: 48.00 USD
Support level: 43.10 USD
Current position: the stock is attempting to consolidate above the recently broken resistance line
Potential downtrend target: if the downtrend resumes, the downside target could be around 39.00 USD
Short-term target: if the uptrend continues and the stock surpasses the resistance at 48.00 USD, a short-term target could be set at 51.15 USD
Medium-term target: the price might rise to 57.00 USD if the positive momentum is sustained
Investors should monitor Dynatrace’s stock closely, as the new partnership with AWS could provide significant momentum, potentially impacting the stock’s performance positively as the company expands its customer base in the cloud computing sector.
—
Ideas and other content presented on this page should not be considered as guidance for trading or an investment advice. RoboMarkets bears no responsibility for trading results based on trading opinions described in these analytical reviews.
The material presented and the information contained herein is for information purposes only and in no way should be considered as the provision of investment advice for the purposes of Investment Firms Law L. 87(I)/2017 of the Republic of Cyprus or any other form of personal advice or recommendation, which relates to certain types of transactions with certain types of financial instruments.
Risk Warning: CFDs are complex instruments and come with a high risk of losing money rapidly due to leverage. 69.88% of retail investor accounts lose money when trading CFDs with this provider. You should consider whether you understand how CFDs work and whether you can afford to take the high risk of losing your money.

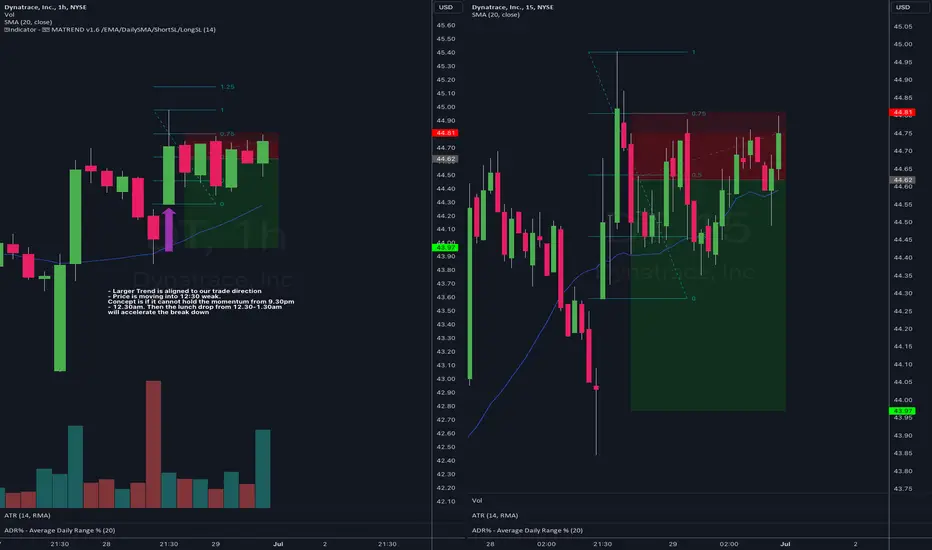
DT - June 24 Qullamaggie Breakout and Episodic Pivot- Larger Trend is aligned to our trade direction
- Price is moving into 12:30 weak. Price concept is if it cannot hold the momentum from 9.30pm - 12.30am. Then the lunch drop from 12.30-1.30am will accelerate the break down
- This momentum was driven by the PCE data. I wonder if I should have just avoided trading on high news impact days
Qulla Breakout & EP (Discretionary & Systematic) 🚀
Swing Trend Strategy focused on Breakouts based on repeated momentum and Episodic Pivots based on unexpected news/fundamentals that is not properly priced in. The entery requirements are always price consolidation and tightening


5/14/24 - $dt - punting a small long into the print, good setup5/14/24 - vrockstar - NYSE:DT - first time looking at this name. checks all my boxes. revenue >25% growth, sub 10x sales (under 40x PE), throws off substantial cash and yields 3-4% depending on how bullish/bearish you are which for a name growing at this rate is a good buy all else equal. stock seems to have gotten ahead of itself in the last print and looking at former prints, i can tell there's no clear consensus on what the result will bring/ and or how to value this one. powell could piss in our punchbowl tomorrow generally speaking, but that's hard to bake into the EPS prints, so if the setups look good, i'm long, if they look bad i'm short or usually out of the picture. this is a name i'd like to do more work on intra quarter when the Q2 season is done. however, i'm punting long in the meanwhile b/c i like the setup. i think the dips get bought and the rip could stick given the growth profile and reasonable valuation vs. peers.

We like the chartNYSE:DT chart shown on a multi timeframe momentum indicator. We like the chart for 3 reasons:
1. Momentum indicator making parabolic curves, one of the strongest signals in our books.
2. This is the second move up following a failed breakout attempt in early April.
3. Rising volume. Its peers NASDAQ:DDOG and NYSE:ESTC also showing strong price action.

$DT, Long, TakeProfit > 20%, P/L = 5/1NYSE:DT , Long, TakeProfit > 20%, P/L = 5/1
We are waiting for a point to enter a long position
The potential for a long position is more than 30 percent
Good luck

New uptrend startingPrice reached bottom of channel up and a breakout will happen soon
The new uptrend can reach 64$
Be careful because market can go into a correction of tech sector very soon

schlong ittouched the fib, confluence with the parallel channel, macd pending bullish crossover.
long that thang baby

Bottom of the channel, long entry?Beautiful long opportunity on 0 debt company Dynatrace as we approach the bottom of a bullish parallel channel.
Please use a stoploss.
Thanks!

Trade the channel?Dynatrace, a company with 0% debt (primed for growth) is trading in a very consistent bullish parallel channel.
Currently at the top of the channel, should come down for a beautiful buying opportunity.
Please use proper risk management.

DT - Trend line break & Bear FlagDT was in a nice uptrend channel until it broke the Trendline recently.
Now its forming a bear flag, lets wait for 45 break for a proper textbook short entry
or
if you've risk appetite, build your short position early.
As the market breaks this sell off can accelerate.
Downside Target - 40

Dynatrace Inc. ($DT): Tech Momentum and Profit PotentialCompany Overview:
Dynatrace Inc. ( NYSE:DT ) operates in the Technology sector, focusing on Software - Application development. As a USA-based company, Dynatrace plays a pivotal role in the ever-evolving landscape of software solutions.
Analysis Summary:
Dynatrace Inc. exhibits strong market signals, characterized by Pull Back (PB), Pocket Pivot, Accumulation, and Bullish Price Volume. In the Technology sector, the stock displays a Relative Strength of 1.45, outperforming its sector and boasting a notable 2.98 against the SP500, indicating a robust competitive position.
The Up/Down (U/D) Ratios for both 50 and 15 days reveal a favorable market sentiment, showcasing a consistent trend of positive price movements. The detected base depth of 27.64% underscores the potential for sustained growth, positioning NYSE:DT as an attractive option in the software application sector.
Recent market dynamics indicate a bullish trend, with the last closing price hovering -2.22% away from base resistance. The volume, surging 47.2% above its 15-day average, reflects strong investor interest and participation in the stock.
Over the past 10 days, Dynatrace Inc. has shown rising trends in price, volume, and accumulation, indicating a positive market sentiment. The stock's resilience is further evident as it rises above its 50-day Exponential Moving Average (EMA).
Historically, local tops for Dynatrace are observed when the price closes around 23.7% above its 50 EMA. With the current closing price at a modest 7.16% deviation from the 50 EMA, there is potential for further upward movement.
Trade Idea:
A strategic entry at $54.73, slightly above the last closing price, aligns with the observed market signals. To manage risks effectively, a well-placed stop loss at $53.45, based on recent lows, provides a safety net for investors.
With a calculated potential upside of 16.34%, the price target of $63.56 offers investors a clear projection. A 6.71 Reward-to-Risk (R/R) ratio positions the trade as an attractive opportunity. Investors entering at $54.73 should monitor market developments closely, utilizing the stop loss as a safeguard in this dynamic software application play.

my levels to trade DTDynatrace Davis uniquely combines predictive AI, causal AI, and generative AI for observability, security, and business use cases.
Leverage causal AI and analytics to get the most from your observability, security, and business data and automate BizDevSecOps workflows across your ecosystem.
650+ supported technologies
Weave Dynatrace’s open API into your existing ecosystem to drive automation in everything from development and releases to cloud ops and business processes.

DT Buying Opportunity $46.54 Price RangeStage 2 retracement level is a good opportunity to purchase DT, of course have to wait and see how this plays out. Looking for support at or around retracement level and sideways movement towards right side of the cup to build a strong base prior to moving up.

DT DYNATRACE INCThe positive momentum is still intact, with the market experiencing a period of consolidation or sideways movement after a strong upward trend. This consolidation phase can be seen as a temporary pause or a price correction before potentially resuming the upward movement. Based on the analysis, the price targets are set at $56-60. SL 49.8

Breakout Buy in DTDynatrace is a software company developing intelligent platforms that allow customers to modernize and automate IT operations.
Their secret sauce? You guessed it… artificial intelligence.
Now only has the pullback been shallow (only 6% from its highs), it also took place on decreasing volume.
I like to see leading stocks making shallow retracements on light volume. This is my clue that the big players are not selling, and the stock has a good chance of pushing higher.
DT is breaking through its $52 pivot point as I type this, making it an actionable trade.
DISCLOSURE: I just bought DT here with a stop loss at 49.80 to risk just under 5% on the trade.

DT good surprise waiting for vcpgood surprise on recent earnings, rsi 70 pierced, will wait for vcp for a buy point, want this 50 to hold else will wait for if 50 doesn't hold will vait for vcp, spy bouncing off the 20
