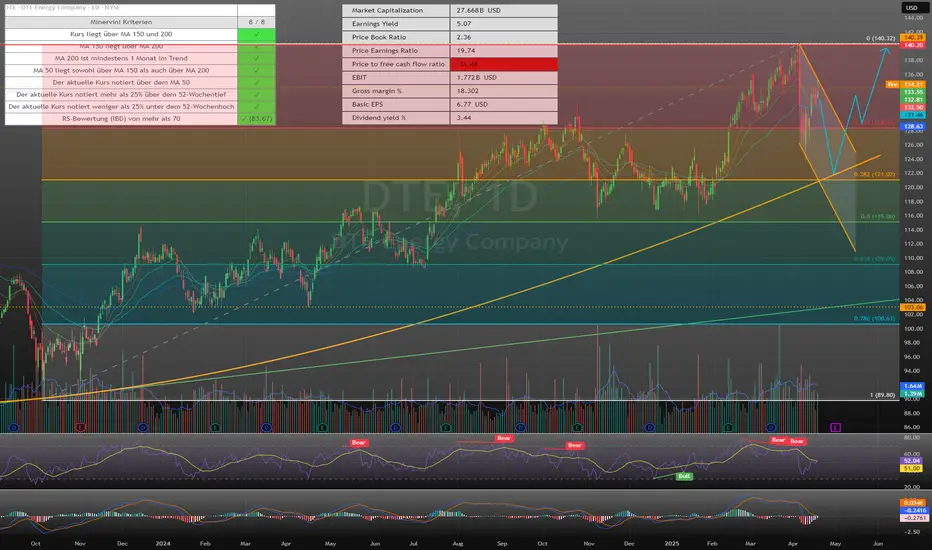
DTE with possible Cup-and-HandleThe share is still in an intact upward trend and has experienced a setback after again knocking on the all-time high (ATH).
This setback from the ATH took place with high momentum and led to a clean pullback. However, there has been renewed weakness since then. On the daily chart, there was a return to the area of the previous bottom formation; at the same time, both the RSI and MACD cooled noticeably. The technical picture brightened somewhat with the subsequent rise, but no new buy signals have yet emerged.
On the weekly chart, the RSI is consolidating, while the MACD could generate a possible sell signal in the event of a further setback.
I expect a renewed downward movement towards 124 USD before the current correction at the high can be considered complete and a “handle” formation joins the “cup”.
A breakout from the handle would be a strong buy signal worth waiting for.
DTE trade ideas
Watchlist: DTEDTE is now on my watchlist for tomorrow. I got a setup signal and with above average volume . Looking to enter long near the close of the day if the stock can manage to close above the last candle highs with a stop-loss below and a price target above.
Remember: "Opportunities don't happen, you create them."

DTE Energy (DTE): Inside The Conduit Of A Major Breakout Electric Power industry, DTE Energy (DTE), is soon expected to post earnings of $1.84 per share for the quarter ended September 2023. This estimate indicates a year-over-year change of +15%. Revenues for the quarter are expected to be $4 billion, down 23.8% from the year-ago quarter.
The consensus EPS estimate for DTE Energy has been revised 13.3% higher over the last 30 days to the current level. However, a lower Most Accurate Estimate has resulted in an Earnings ESP of -2.99%.
This Earnings ESP, combined with its Zacks Rank #3 (Hold), makes it difficult to conclusively predict that DTE Energy will beat the consensus EPS estimate. Over the last four quarters, the company surpassed consensus EPS estimates three times.

DTE Energy WCA - Symmetrical TriangleCompany: DTE Energy Company
Ticker: DTE
Exchange: NYSE
Sector: Utilities
Introduction:
In today's analysis, we are examining DTE Energy Company (DTE) on the NYSE, a key player in the utilities sector. The weekly chart reveals a potential bullish reversal in the form of a Symmetrical Triangle pattern that has been forming over the past 42 weeks.
Symmetrical Triangle Pattern:
The Symmetrical Triangle pattern is typically a sign of indecision - a battle between the bears and the bulls. However, in this instance, it seems to be acting as a reversal pattern after a downward trend.
Analysis:
The previous trend for DTE Energy was downward, but this seems to have been interrupted by the symmetrical triangle pattern, suggesting a potential reversal. The triangle has 2 points of contact with both the lower and upper diagonal boundaries.
The price is currently above the 200 EMA, indicating a bullish environment. Furthermore, we've recently observed a breakout above the upper diagonal boundary, which would support a long entry. The price target following a successful breakout is set at 137.43, representing an estimated increase of 21.63%. However, a minor resistance could be encountered at around the 138 level.
Conclusion:
DTE Energy's weekly chart presents an encouraging bullish reversal setup. If confirmed by sustained price action above the triangle's upper boundary, this could provide a compelling long trading opportunity. It's important to monitor the potential resistance at 138, as it could affect the continuation of the bullish trend.
--------------------------------------------------------------------------------------------------------------------
Please remember, this analysis should form part of your comprehensive market research and risk management strategy, and it is not direct trading advice.
If you found this analysis helpful, please consider liking, sharing, and following for more insights. Wishing you successful trading!
Best regards,
Karim Subhieh
Disclaimer: This analysis is not financial advice and is intended for educational purposes only. Always conduct your own research and consult with a financial advisor before making investment decisions.

$DTE with a Bullish outlook following its earnings #Stocks The PEAD projected a Bullish outlook for $DTE after a Positive Under reaction following its earnings release placing the stock in drift A with an expected accuracy of 77.78%.

$DTE with a Neutral outlook following its earnings #Stocks The PEAD projected a Neutral outlook for $DTE after a Negative Under reaction following its earnings release placing the stock in drift D with an expected accuracy of 40%.


DTE Energy reports strong third-quarter 2020 results; company inDTE: DTE Energy
2020-10-27 07:00:10
DTE Energy reports strong third-quarter 2020 results; company increases 2020 guidance, provides 2021 early outlook, and increases dividend 7%

DTE ENERGY CO is to BUY DailyHey guys, DTE ENERGY CO is in a bullish configuration, low buying volume potential to go up to go above the previous first two above and start falling again. With the many volumes of purchases previously made, attempts by aborted sellers or else we can go down and then go up again.
Please LIKE & FOLLOW, thank you!


DTE - Weekly Mean Reversion - Bull Put Credit SpreadLow Weekly RSI & Low HV.
W RSI <20
Looking for Reversal to Mean higher.
Taking 125/120 Bull Put Spread.
with 130 Calls for directional bias Higher.
Dec Exp but aiming to Close in profit well before that...
Good Luck - Watch your $$$ RISK
...Any questions just DM me...


DTE Flight to safetyBond yields are low, market is tanking, you know what comes next....
Flight to safety in high yield utilities. DTE dividend is 3%.
Another short term play, just looking for another buck a share here, not much.


Will DTE bounce from 61.8% Fibonacci level ?DTE is currently sitting on 61% Fibonacci level. Oversold RSI and stocastic. Bollinger oscillator changed direction outside the range and converging. I am bullish!


DTE Detected possible increase in guidanceDTE: dte energy company
2018-02-16 07:00:14
Detected possible increase in guidance


