Stock Of The Day / 07.23.25 / FI07.23.2025 / NYSE:FI
Fundamentals. The earnings report exceeded expectations.
Technical analysis.
Daily chart: Downtrend
Premarket: Gap Down on increased volume. We mark the premarket low of 136.0
Trading session: The price did not continue the downward movement and formed an uptrend after the initial impulse down. The key moment is the reaction to the level of 136.0: if the downward trend will continue or the trend change to an uptrend will be confirmed. We observe the price tightening to the level of 136.0 against the uptrend with a clear hold of the level, after breakout the level. We consider a long trade to continue the upward movement in case tightening structure is broken upward.
Trading scenario: pullback along the trend (false_tightening) to level 136.0
Entry: 137.21 when the tightening structure is broken with exit upwards.
Stop: 135.79 we hide it behind the tail of the last pullback.
Exit: You can hold the position until the end of the session with due patience.
Risk Rewards: 1/4
P.S. In order to understand the idea of the Stock Of The Day analysis, please read the following information .
FI trade ideas

BUY FINews has given us an opportunity to buy at a good price. Although its below our significant demand level i see this stock turning around.

Fiserv Falling Knife TradeLooks like Fiserv is entering an area of interest. I will SLOWLY start an accumulation here between $125 - $136 for my first buy and looking to lower levels to add more aggressively.
A vicious ABC correction and we are currently sitting on on the 0.786 Fib. If this fails to hold, we have a monthly and weekly level of support below. If this fails, it could head down to $100.
Not financial advice, do what's best for you.

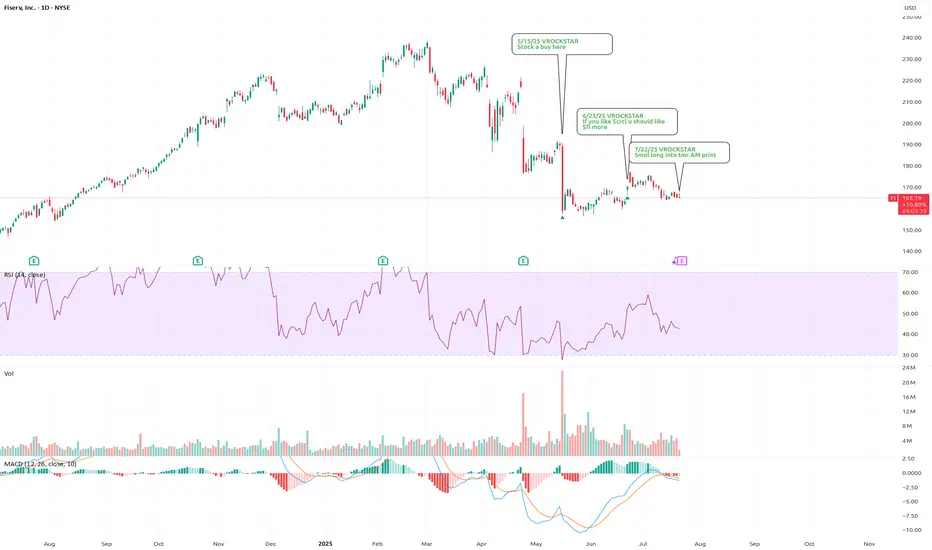
7/22/25 - $fi - Smol long into tmr AM print7/22/25 :: VROCKSTAR :: NYSE:FI
Smol long into tmr AM print
- sub 20x PE and 2x peg (pf adj. for debt) is reasonable for mkt leader
- like the stable coin angle, think they really talk this up... as i've written about previously
- v "consumer" exposed (similar to how i wrote about NYSE:DECK ). if this name sells off hard, i'd be happy to 2...3x the size of position, lower and ITM with a longer-duration strike
- but ultimately at 5% fcf yield, strong mgmt, mkt leader... the setup is probably a 7/10 long and usually i take these pitches but size moderate in order to not lose too much, more of a sharpen the knife position... and remain on my radar to make bigger move if/as. not wed to the stock, think there's other stuff i'd want to own LT instead, but interesting trade for my consideration/ book
whatchu think anon?
V
FiservInsiders have sold $239 Million shares on MAY 29TH. We expect price to rally from these lows to visit the 50% Fib levels. This is a contrarian play as 4,024 Puts are in play which means more Bears are betting on a drop. This means a lot of Stop Loss orders are prime above the $170 level. This will be a Fade the market play.

6/23/25 - $fi - If you like $crcl u should like $fi more6/23/25 :: VROCKSTAR :: NYSE:FI
If you like NYSE:CRCL u should like NYSE:FI more
- all banks will have their own stable coins
- but for a player like FI what makes their launch so unique is that it can/ will likely be used for much more txn volume than any given bank based on their payments role/ pole position
- at 4.5% fcf yield, growing just fine, stock isn't an obvious buy
- but given the px action on $crcle (which now trades above it's USDC mkt cap - go figure), and the scarcity of stable-coin beta (apparently this one is getting all the attention), it wouldn't surprise me if NYSE:FI gets some love - and at least you're more protected on the downside valuation-wise ( NYSE:CRCL is just... odd. careful fam).
flagging
V

$FI, Long, TP>15-20%NYSE:FI , Long, TP>15-20%
Fundamentally the stock is good.
Choose an entry point and do not forget about a protective order if you are trading with leverage.
Don't risk it if you're not sure.
Good luck to everyone.

$FI bounce coming off 30% ATH drawdown $170 targetHello, NYSE:FI Fiserv evidently got hammered to the downside the last month and last few months the name is down 30% from it's all time high from March 2025 and last month and change it is down 25% or so after downgrades. I have been watching the name the last week or so and I was looking for a drop into a zone of activity in the $152-$154 but it seems that $158-$160 is a strong area of support. Now I am tempted to grab some calls on this name but I am unsure the outcome. The latest Daily candle accumulated the most volume it's had in 2 weeks above 11 million. It bounced off the zone area highlighted. The calls I added to my watch were $170c for 7/18, last week they bottomed around $2.00-$2.20 and they closed (5/30/2025) at $3.30. That's a good move in itself. Will be watching.
WSL

DCA into $FI- NYSE:FI is big recognizable brand in Point of Sales. You might have seen clover handheld machines.
- I believe fundamentals on this blue chip company is getting cheap. I'm not going all in but have started DCA into this name.
- If it falls further 20-30 or even 40% I will be happy to DCA further.
- Fundamentally, I am buying it close to fair value.
Year | 2025 | 2026 | 2027 | 2028
EPS | 10.21 | 11.91 | 13.88 | 15.72
EPS% | 16.35% | 16.63% | 16.51% | 13.25%
- Any company which is growing EPS% mid teens with a recognizable brand value deserves a fair forward p/e of 20
Base Case Fair Value w/ forward p/e = 20:
Year. | 2025 | 2026 | 2027 | 2028
Fair Value | $204 | $238 | $277.6 | $314.4
Conservative Base Case fair value w/ forward p/e=15:
Year. | 2025 | 2026 | 2027 | 2028
Fair Value | $153.15 | $178.65 | $208.2 | $235
Bull Case Fair value w/ forward p/e=25:
Year. | 2025 | 2026 | 2027 | 2028
Fair Value | $255 | $297 | $347 | $393
Bear Case fair value w/ forward p/e = 10:
Year. | 2025 | 2026 | 2027 | 2028
Fair Value | $102 | $119 | $138 | $157

5/15/25 - $fi - Stock a buy here5/15/25 :: VROCKSTAR :: NYSE:FI
Stock a buy here
- industry POS leader
- CEO chat at JPM conf not helpful for px action, but ahead of opex tmr, this chad should be a bit more heads up. then again, most mgmt have no idea how stonk mkt works.
- at sub 20x PE this thing is objectively a buy, nearly 4.5% fcf yield and growing DD will work in time
- in this tape i'm a bit more careful, and at the moment i'm wrangling GAMB (today)
- so if this thing opens red tmr and/ or next week... i'd be willing to dip buy, probably for a trade
- but if u r a diversified investor (like a lot of positions... not my style), then this would be an obvious consideration today and with the right size mgmt to scale to full size if/as we go a bit lower.
b well my friends
V

Fiserv (take 2) at 211.19As some of you may remember from back in early December, this is not my first idea for $FI. At the time, I hyped it up as a top performer for me, only to make a measly 0.27% on the trade in one day (which is still about 6x the avg daily return of the market). I was disappointed in the return, but VERY happy the next day when the CEO left and it dropped 6% (yellow oval on the chart). FPC saved my butt on that one, and I promise never to bad mouth a gain on FI again. I actually traded it again the day of the announcement and made 1.6% in a day that time.
My case then, as it is now, is that FI has been a stellar performer for how I trade. It is top 3% of all large caps I trade and has returned about 5x the daily return of SPY over the course of now 950 trades. Its record in those trades is 950-0-1 with the one being yesterday - a signal from my algo I did not trade because it hit within 1 min of the close when the stock dropped almost .25% in a minute. Sometimes luck favors you, as it opened higher today but fell back to me late in the day so I got it even cheaper today. The average return on trades in FI is +1.89% and the average holding period is 9 trading days, but the majority of trades have closed in 1 trading day.
In addition to its historical performance, it is at about the midpoint of its 6 month range, still in a strong multi-year uptrend despite the recent correction, and has support in the vicinity from the January low and from the medium term trend line. All reasons for me to take this trade, even during a correction.
So I'm in with an initial lot at 211.19. SInce I got a bunch of new followers today, I'm gonna briefly explain how I do this. I will tactically dollar cost average (equal dollar amounts) on any day FI is still rated by my algorithm as a buy. I sell any lot on the first day it is profitable at the close. Once all lots are closed, the trade is finished. I will update all trades I make here on the same day I make them (or at least almost always the same day - I'm not perfect).
As always - this is intended as "edutainment" and my perspective on what I am or would be doing, not a recommendation for you to buy or sell. Act accordingly and invest at your own risk. DYOR and only make investments that make good financial sense for you in your current situation.

FI- Finance • Regional BanksFI popped up on my scanner today. Looks like it wants to let go. Watching 228.80 area for put entry. Let's see if we can hit some targets! GL!

FI | FiservScreener Buy Idea
Fiserv, Inc. engages in the provision of financial services technology. It operates through the following segments: Merchant Acceptance, Financial Technology, and Payments and Network. The Merchant Acceptance segment provides commerce enabling solutions and serves merchants of all sizes around the world. The Financial Technology segment offers technology solutions needed to run operations, including products and services that enable financial institutions to process customer deposit and loan accounts. The Payments and Network segment includes the provision of services to financial institutions and corporate clients with products and services required to process digital payment transactions. The company was founded by Leslie M. Muma and George D. Dalton on July 31, 1984 and is headquartered in Milwaukee, WI.

Long Fiserv @ 215.38 - You do NOT want to miss this one!C'mon, look at that chart. It's the chart equivalent of a cute puppy.
How could you not love it? It has a little something for everyone. The chartists will love how the close today sits right at the confluence of both recent support and the trend line. It's not volatile, it's beautiful.
And for me, it's only given a buy signal 12 times in the last year before today (because it doesn't correct hardly ever). Unsurprisingly, all 12 have been profitable. In that time, the average gain has been 1.27% and the average holding period was LESS THAN 2 DAYS (the LONGEST trade in the last 12 months lasted 7 trading days - but it was also the biggest win). That works out to a stellar .66% per day held this year - about 15x better than the S&P 500 average daily return.
Over a longer time frame, I have a ranking system that factors in gain per day held, total number of trades (sample size), largest drawdown (based on how I trade) and average number of days held per trade. Out of roughly 750 stocks with market caps above 10B, it has the 4th best composite score. It is both very profitable, very safe, and produces quick returns, historically. For comparison, the only stock I've posted on here as a trade idea that has a better lifetime composite score than VIE:FISV is $MSFT. That's some pretty good company when you think about how well NASDAQ:MSFT has done over its lifetime.
So obviously, I went long today at the close. Per my usual strategy, I'll add at the close on any day it is still rated a 'buy" by my algo, and I will use FPC (first profitable close) to exit any lot on the day it closes at any profit.
As always - this is intended as "edutainment" and my perspective on what I am or would be doing, not a recommendation for you to buy or sell. Act accordingly and invest at your own risk. DYOR and only make investments that make good financial sense for you in your current situation.

ParabolicSince July we are seeing an uncorrected parabolic(I would call it hyperbolic already) rise.
Tiome for a correction, isn't it?

Fiserv: Trading Opportunities!Recently, the FI stock surged directly into our green Target Zone (coordinates: $186.40 – $207.40). This year alone, it has gained over 40%. With the recent arrival in our Zone, the time is now ripe for an overarching trend reversal. Because: by hitting our Zone, the price has reached the absolute minimum target for the green wave . From a technical perspective, an immediate trend reversal and a transition into wave II are now possible. At the moment, we place Fiserv in the turquoise wave 3, which should be followed by another dip below our Target Zone. Ultimately, the entire turquoise upward impulse should complete the overarching uptrend of the beige wave I. Thus, our Zone can be used to take profits from existing long positions or to initiate new short trades. Such potential short positions can be hedged with a stop 1% above the 78.60% retracement level (at $207.40).

Fiserv: At the crossroadsWe primarily expect Fiserv to drop into magenta Target Zone between $134.54 and $120 as part of the same-colored wave (2). Investors could then open long positions there, with stops placed around 1% below the lower edge. Subsequently, we expect a rise above the resistance at $165.28. We consider an earlier break of this level to be 37% likely. In this case, however, it would only be the magenta-colored wave alt. (1).

Fiserv Fights a TrendlineFiserv has squeezed into a tight range, and now some traders may think a breakout has begun.
The first pattern on today’s chart is the falling trendline since the end of March. Notice how the provider of banking IT services has crossed above that line.
Second, FI has repeatedly bounced at $146 since late February. That could suggest support has been established above its previous all-time highs.
Third, FI tried to rally on April 23 after raising guidance. However MACD was falling at the time and that negative momentum dragged on prices. This time, however, the oscillator is rising.
Next, Bollinger Bandwidth recently tightened to its narrowest reading since January 2020. Will that volatility compression give way to expansion?
Finally, the 50- and 100-day simple moving averages are on top of each other. That highlights the period of consolidation and may reflect a longer-term uptrend.
The 8-day exponential moving average (EMA) also crossed above the 21-day EMA. That may reflect a shorter-term uptrend.
TradeStation has, for decades, advanced the trading industry, providing access to stocks, options and futures. See our Overview for more.
Past performance, whether actual or indicated by historical tests of strategies, is no guarantee of future performance or success. There is a possibility that you may sustain a loss equal to or greater than your entire investment regardless of which asset class you trade (equities, options or futures); therefore, you should not invest or risk money that you cannot afford to lose. Online trading is not suitable for all investors. View the document titled Characteristics and Risks of Standardized Options at www.TradeStation.com . Before trading any asset class, customers must read the relevant risk disclosure statements on www.TradeStation.com . System access and trade placement and execution may be delayed or fail due to market volatility and volume, quote delays, system and software errors, Internet traffic, outages and other factors.
Securities and futures trading is offered to self-directed customers by TradeStation Securities, Inc., a broker-dealer registered with the Securities and Exchange Commission and a futures commission merchant licensed with the Commodity Futures Trading Commission). TradeStation Securities is a member of the Financial Industry Regulatory Authority, the National Futures Association, and a number of exchanges.
TradeStation Securities, Inc. and TradeStation Technologies, Inc. are each wholly owned subsidiaries of TradeStation Group, Inc., both operating, and providing products and services, under the TradeStation brand and trademark. When applying for, or purchasing, accounts, subscriptions, products and services, it is important that you know which company you will be dealing with. Visit www.TradeStation.com for further important information explaining what this means.

Fiserv ,,, Flag pattern Uptrend
In my view, It is a Flag pattern and the descending trend line has been broken and also a price level as well, in daily time schedule. there is a good bullish candle as a trigger for entry to buying position. Next target could be at about all time high and the long-term target, based on the Flag pattern, at about $200. Do not setting up a sure SL for your position, my offer is at about $145.

Caution: Expect FI (Fiserv) to Sell OffThe fundamentals are looking great for FI no denying that. However, we have a text book 4th wave triangle you can see on the chart then with a thrust into a 5th wave. We have met the measured target of Wave A of the triangle = Wave 5. It's also interested to note a lot of top insiders have been selling at these prices. Also, not shown is monthly divergence, which is expected in a 5th wave. Expect prices to move to at least below Wave 4 around $109 or lower. Once a wave A sell off happens we can project for a wave C projection before prices could move up.

Fiserv: Time to Descend 🧗🏽♀️The price of Fiserv should have recently placed the high of the magenta-colored wave (1). We now expect the magenta target zone to be reached between $134.54 and $120. Within this range we expect the low of the same-colored wave (2). We consider it 37% likely that a higher high of the magenta-colored wave alt. (1) will occur.

Enter long entryTo my dismay, financials are in disarray. Oh I look far and wide for one that will raise my pay. As I carefully look around within this space, Fiserv looks to be the way. Upside I see along the way, enter I must say. To my finance bros, I do must say. Why treat other finance stocks like so with so much at stake. Today is yet another day, for I have found one that the technical's lead up to one way. Up I say.

Fiserv: Ready for the descent 🛝Fiserv has retreated a little since last Thursday. We now consider the high of the turquoise-colored wave B to be in place and expect a sell-off to below $120 in order to complete the magenta-colored wave (E). A drop below the $130.74 mark should provide important downward momentum along the way. However, the 30% probable alternative still needs to be considered. This option would shift the high of the turquoise-colored wave alt.B slightly higher.
