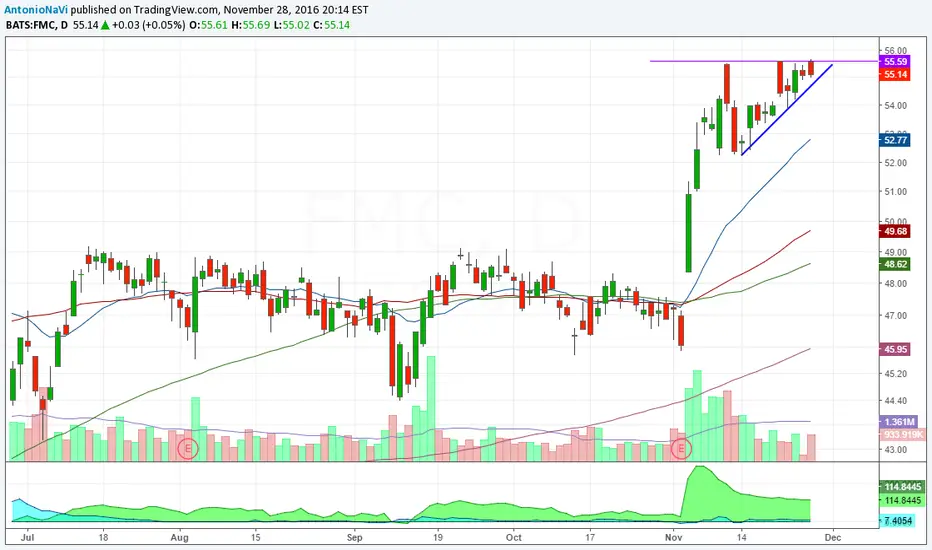
FMC is getting ready to make a movethis could be just a conspiracy and wallstreet trickery but i think a breakout could be coming soon
FMC trade ideas

$FMC Inverse H&S / Golden Cross$FMC Inverse H&S / 50d/200d Golden Cross
Headed back to upper 90s in near term

Swing trade on FMCI believe this will trade down until it hits a old support. I'm going to monitor this one for this entry.

Going long FMC on WednesdayFMC is printing a bullish candle over candle price bar, near its 50 DMA, with my momentum/trending oscillators confirming the price move. I am going long FMC on Wednesday using a limit order (GTC-BUY-LMT) @ 94.42. I will have two trailing sell stops (GTC-SELL-STP) @ 89.99 and 87.61 to protect my initial invested capital in case FMC does not move higher immediately. I am expecting a measured move similar to all or part of the previous uptrend from Nov. '16 - Oct. 17.

FMC Long Soft target almost reached, new entry levels as followsMy initial entry was at 44,18$ with soft target at around 94$. Almost got there and Elliot wave 5 seems to have topped out short before also seen by the divergence on AO. Now looking for rebound targets. sold a 3rd of my position at 89, for a quick double up :)
set new buy limits @ 63$, 60$, 56$ and 51$.

#FMC Which way are they headed on Monday? Wait and see........DuPont Announces Agreement with FMC
money.cnn.com


Not Great Company But Bullish Pattern Could mean alotThe recent bullish pattern if indeed is confirmed though it requires further scrutiny and not every pattern results big win, it may be a good to add your watch-list for a possible 17% upside gain provided that market helps it. The Head and Shoulders Bottom is created by three successive declines in the price following a significant downtrend. The lowest low (head) is in the middle, flanked by two higher lows (shoulders) at roughly the same level. Volume is highest as the price makes the first two declines, then diminishes through the right shoulder. Finally volume surges as the price closes above the neckline (drawn between the two highs) to confirm the reversal. If you decide to take a long position, use tight stop at recent swing low at and around $54 area. If you want to have a real time alerts on this security try us www.2waytrading.com


FMC - Double channel knife catch. Pullback - Double channel
Status: Too many red flags for me to consider buying, or even put on my watchlist
Horizontal S&R: 65
Channel S&R: 2 channels, neither holding very well.
MA S&R: no
Stochastic turn/crossover above 80%: yes. looks embedded
AO pullback >0= 85: yes
Price Pullback Fib >0.382: yes
Next Earnings date: 10/27
Increasing EPS: missed, but in range
Increasing Rev: beat
Short Float:
*stop 1 atr below swing low.
** first price target is 50% the move from entry price to previous high.
***No Biotech
Any feedback is welcomed! Thx
Cost basis:
Stop:
First price target:


FMC POSSIBLE BREAKOUT FOR SHORTINGLooking at previous rising wedge breakout i've measured a retrace under 0.61 fib. The breakout occurred after 291 bars on weekly chart and happened with many gaps. Now we have a similiar pattern, time symmetry, a gap that's going to break lower trendline and volume increasing. Need to see a strong distance from lower trendline, possible gaps and more volume for confirmation. As a possible target i'm pointing to 0.61 fib area. Good luck for your trading
