FSLY trade ideas


Possible incomeAfter the sharp decline on Thursday, I see a correction to $ 74 where there is strong support, which also coincides with the 0.5 Fibonacci retracement. For this reason I coincide a possible income in search of a rebound with SL at $ 72

Not so Fastly $FSLYMight be heading back to consolidate between its previous horizontal weekly ranges.


Wait for the dust to settle - could test 50% fib retracementGuidance for Q3 2020 revenue was cut to $70 million from $73 million. This ran up way too fast and was extremely overvalued. The street is now giving it a nice haircut. Technicals indicate that this may be headed to the 50% fib retracement at $73.53.


Buy at 80-85 RangeI think its a great opportunity.
Ark investment bought this stock. However according to income statement and balance sheet it is not a buy but for future prospect it can be bought. Tiktok issue can be solved when Biden will be president.
The trade war with china will over when Biden will win.
Suitable for swing trade.


FSLY SHORT opportunityThinking we still have some space to drop, some major levels I think we will see are $85 and $79

FSLY hit yet againGuys this is a cash register. Go long soon, wait a day or two to make sure the shake out is over.

FSLY watch for the relief bouncIt's possible we may see a relief bounce in FSLY tomorrow. This could make for a quick scalp long or a chance for
people holding shares to get out at a better price. I'll be watching for a move back into 100/105 area. Alternatively, if we lose the
post market low, price is likely to test the bottom of the box I have drawn. I would not recommend buying
and holding the dip. These selloffs rarely find bottom in the first 2 days. Better to wait unless you are scalping
or trying to get out.

Pull Back FishingNot sure what happened. Bad day in the market peraps and this one is volatile.
Earning on the 28th
Not a recommendation

$FSLY Support Levels to Watch for Fastly IncReally terrible day ahead for FSLY investors, so here are the support levels we are watching for today.
$85.33 is Fibonacci and Monthly candle support.
$81.63 is the 100ma.
$79.37 is the Fixed Range POC
$75.00 held during the September selloff and may very well get tested once again.
Hopefully we have seen a over reaction on what was already a negative environment.


FSLY hit support! Let's go up from here...FSLY's massive after-hours drop today was caught perfectly by our Raygun support/resistance script.
I think we'll bounce back up from here.
If not, these levels will be important as we helix around them fro seeing where we're going to go next.
I'm keeping my eye on this for a S/R flip...

congrats to those who got in!but id look for a dip entry, what goes up must come down. remember shorts have to eat too ! :) dont get caught up here, gl!

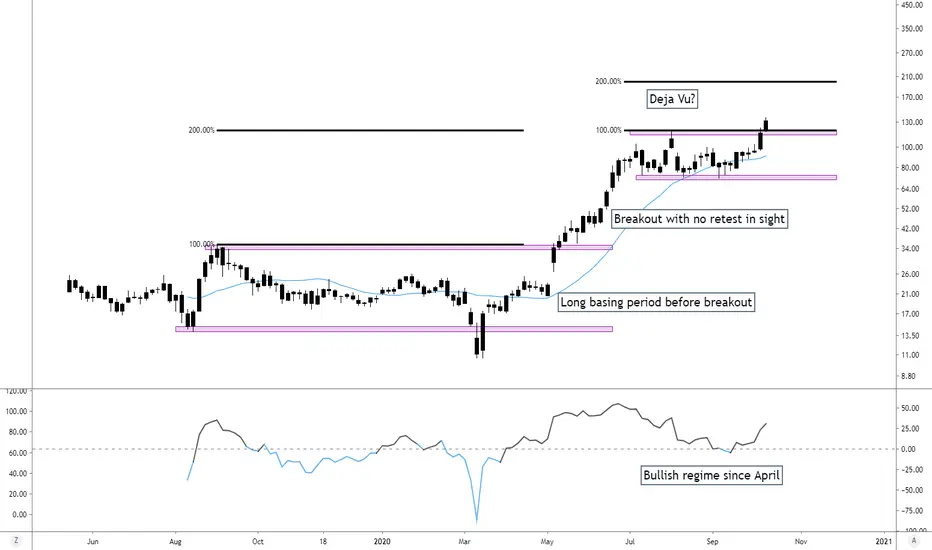
Breakouts are for BuyingWhen we look at the headlines, we have to realize that these are just trying to grab our attention and take away from what we should be really paying attention to. Breakouts! Instead of just looking at the index or tuning into financial media for the latest narrative, we should be looking for things to buy. Today we will look at FSLY. Let’s hop on the chart.
This is the type of chart that we want to own. The pullback that took place didn’t affect every stock the same. Some of the stocks just went into a basing pattern and are now breaking out. This is bullish. Last time we saw a breakout like this, we went all the way to the 200% fib extension. The breakout looks very similar to last time and the stock has stayed in a bullish regime since April. We have a bullish trend and a bullish breakout. What more could you ask for?
Happy Trading!