FTS means "for the success!"FTS appears to be the gift that keeps on giving. This second entry reinforces the shift to bullish momentum. This is going to be a killer play as the market pushes towards the next untapped supply.
FTS trade ideas

Bullish Alert : FTSPositive price action with a great level at 42.02 together with new test for a possible crossover

FTS - Strong Uptrend Strong Uptrend in green
The basis of this analysis is the strong uptrend and its support capabilities
Consistent rejections have been seen off the green trendline
Bullish support

$FTS with a Bullish outlook following its earnings #Stocks The PEAD projected a Bullish outlook for $FTS after a Negative over reaction following its earnings release placing the stock in drift C.

$FTS with a Bullish outlook following its earnings #Stocks The PEAD projected a Bullish outlook for $FTS after a positive over reaction following its earnings release placing the stock in drift B.

Fortis FTS - Priced in at the momentI have a position in FTS which I will be selling.
_________________________________________________________________________________________
Fortis released their annual earnings report:
www.fortisinc.com
Fortis is an electric and gas provider, diversified in the North American market as well as Caribbean countries.
I would highlight that this is one of those boring slow/long type of holdings, Fortis would not make you insane returns quickly, but I think it is a defensive position in a long term portfolio, I own a very small position, for the purpose of being able to put more money into it should the price become more appealing later.
They are diversified by region, and are on plan to reduce carbon emissions by 75% by 2035 and move into responsible energy production. Fortis is also a dividend stock and they sustained 45 years of increasing dividend payments to shareholders.
I wont make a long post here, I just wanted to pencil out my personal price targets (Note for my self mostly)
EPS (TTM) 2.61
Analyst expected growth rate 5.06% (which is not attractive)
Average PE ratio over 5 years 18.8
Anticipated EPS in 5 years 3.34
= $ 62.79
___________________________________________________________________________________________
Based on a 15% return each year, Fortis be attractive today at $32 (IMO).

Fortis being accumulated, great clean energy playVery boring stock but also very resilient, great div.
Target $63 range.


FTS Bounced right where it needs to with strong close!My position i bought Friday is in the green and stop moved right below that support line. I posted about why i bought this before the breakout on Friday (link below).
I am expecting more upside tomorrow. Earnings on the 30th.

FTS Long Entry anticipating a #rectangle #chartpattern #breakoutBought some FTS on Friday. Interesting setup inside the rectangle pattern. price tested upper boudrey resistance and pull back into 4 support areas conversing. 20 EMA, 200 EMA and small daily gap on July 15th AND short term breakout pullback! Worth a shot. I normally wait for the breakout but this one is interesting to watch how it will play out.

Well Defined Rectangle Setup on FTS #breakout #rectangle Utilities were up 8% last week. That sector picked up steam and NYSE:FTS forming one of my favorite chart patterns #rectangle. Watching price action next week for a long entry.


A fundamental and technical analysis of FTSThe analysis left incomplete b/c of the 20-minute time limit. Conclusions in the next video.

Update on FTSGood day for FTS (and most of the other instruments). Tomorrow will be a big day for FTS.

FTS, Price action analysis A short overview of what's happening with FTS. Waiting for Monday to get the clear signals.

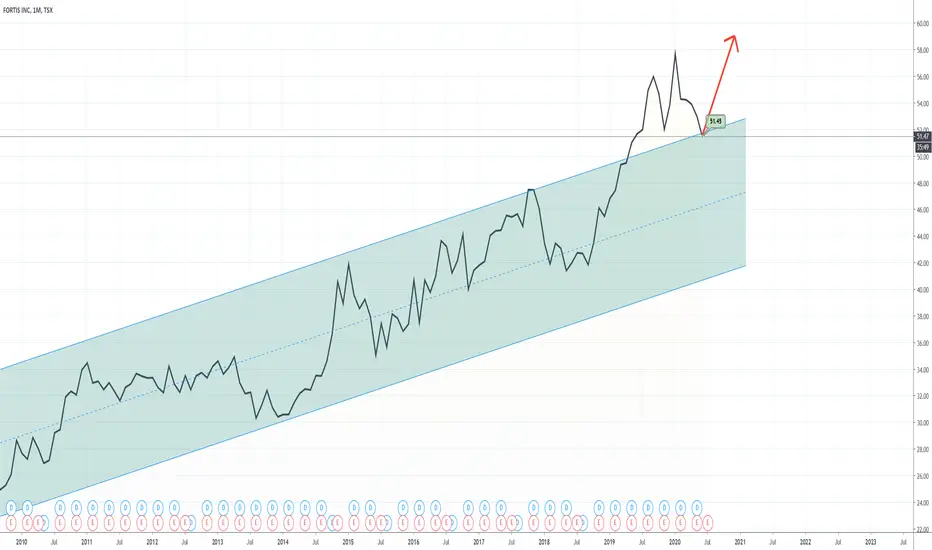
FORTIS: A World Renowned Dividend Aristocrat with StabilityFortis is one of my favourite companies: after all, in an unstable environment that we are currently in, with a likely recession right before our eyes, investors should be seeking undervalued, defensive and dividend aristocratic stocks.
I personally own about 2500 shares of the company and always looking to buy more. This is one of the few companies that has actually seen remarkable growth over the past several years and decades and has a nice uptrend with a 46+ consecutive year in dividend hikes; another one of my favourites is TC Energy (TRP).
Another benefit is that Fortis has nearly 100% regulated utilities which means they own all the infrastructure in which they supply. This offers investors with growth and stability.
Technically speaking the stock has actually broken out of about a 30+ year channel to the upside and should see multiple expansion, especially as people flock to defensive stocks like utilities once again. Growing EPS and only trading at about 14x P/E is quite cheap in this market and I wouldn't be surprised if we see Fortis topping 70 bucks in 2020.
In general, most dividend aristocratic stocks usually have relatively poor growth over many years and/or are somewhat unstable, however, Fortis represents one of the few shining lights.
As I have said numerous times, this is not the market you want to be on the offensive. I pin momentum stocks like Apple and Microsoft having a minimum of 15% more downside than current price - and thats assuming the environment does not drastically worsen (which could be rather improbable betting against that).
Stay cautious and play safe and don't listen to the cows on CNBC saying to "buy all dips at all times".
- zSplit

Extended 5th wave into a cup and handle.We can see a bearish harami which may signal the start of wave 4 and it is coming down from an extremely high rsi of 87 with the macd ticking down. We can see that the 55 ema is approaching the trend line ,which in my opinion is a likely pivot point as it will be a point of both static and dynamic support. But there is also other areas of support that may coincide where the 21 ema is to signal the start of wave 5.
Moreover, taking a look on the weekly (and monthly)we can see that it is on an up trend favoring this play.

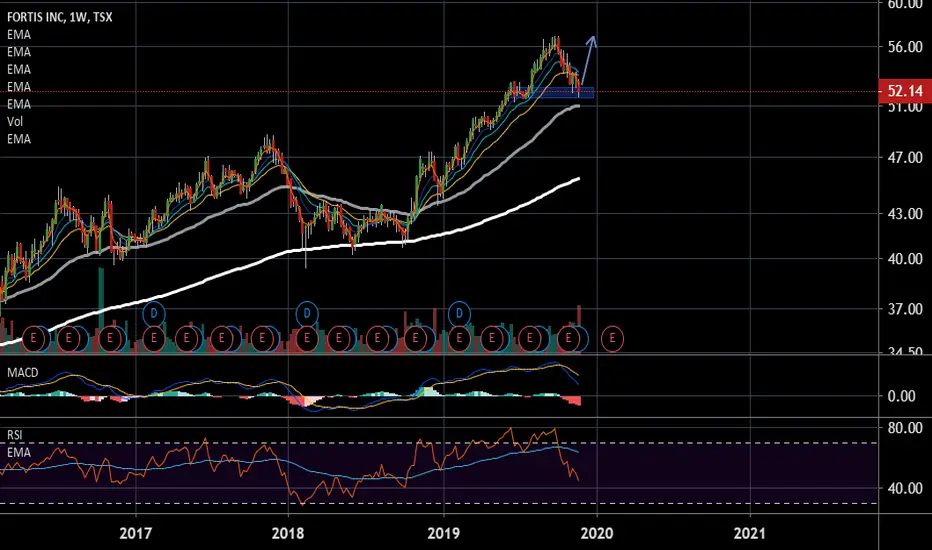
possible longterm breakout soonLooking at the Daily chart we can see that the 200 EMA was rejected 4 times. Furthermore, it is confluent with an important resistance area around 51.50. There was a recent rejection on November 12 as well on the 26.
one thing to notice was how large the volume was on November 26th ending with an important bull victory.
The RSI has a bullish divergence if you look closely. Not sure how high it will be but it looks like a large bull flag from the weekly chart and will likely another critical point of 57.00. If bulls win that battle then potentially another large breakout will ensue. If not it may be a reversal.
Fortis short
Trend has been reversed, and stock started a decline. I suspect decline from CAD$46 to CAD$42. Slow stochastics and RSI are overbought.

FTS.TO ABC moveAppears to be a classic correction wave to Fib 618 zone (target)
Entry triggered on Friday morning session.
My standard 40/50 pullback trade setup.

