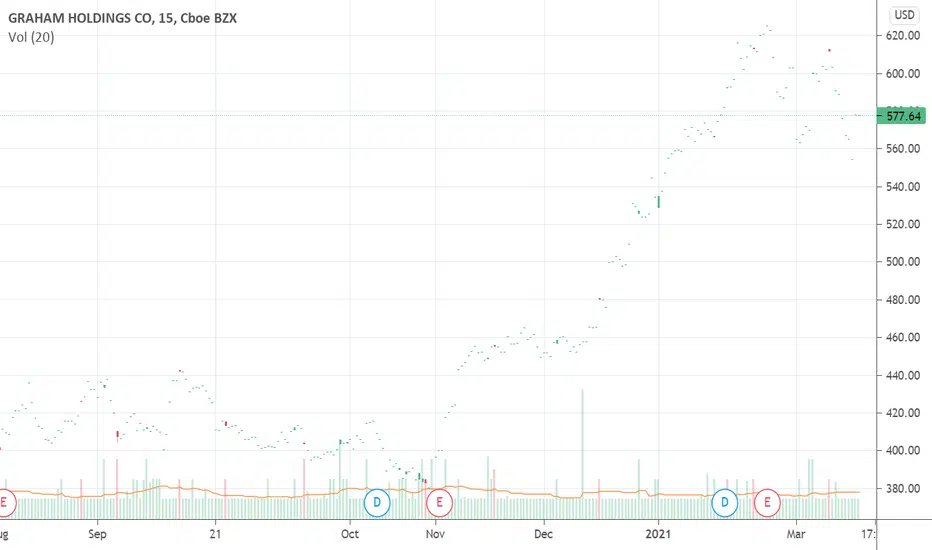
Graham Holdings Co. (NYSE: $GHC) Meteoric RiseNYSE:GHC spiked in price yesterday to as high as 32.90 %. Can it maintain this momentum?
Graham Holdings Stock is trading above its 200-day simple moving average with the 50-day Moving average above the 200-day Moving Average.
NYSE:GHC is also trading near the top of its 52-week range with Investors pushing the share price higher, and the stock still appears to have upward momentum. This is a positive sign for the stock's future value.
GHC trade ideas

GHC is looking very bullishNYSE:GHC is a solid stock which did not recover well after the pandemic fall, I expect a pull back to around 500$ which IMO would be a good opportunity to take a position. Anticipated price action is shown on the chart, target is the 640$ area. Stop level is 440$.
Hit the like button and follow if you find this useful :)
This is only my own view and not financial advice, do your own analysis before buying or selling
Happy Trading!

Leaf Group to be Acquired by Graham Holdings Company for $8.50 PLEAF,GHC: Leaf Group Ltd.
2021-04-05 07:30:00
Leaf Group to be Acquired by Graham Holdings Company for $8.50 Per Share in All-Cash Transaction Valued at $323 Million
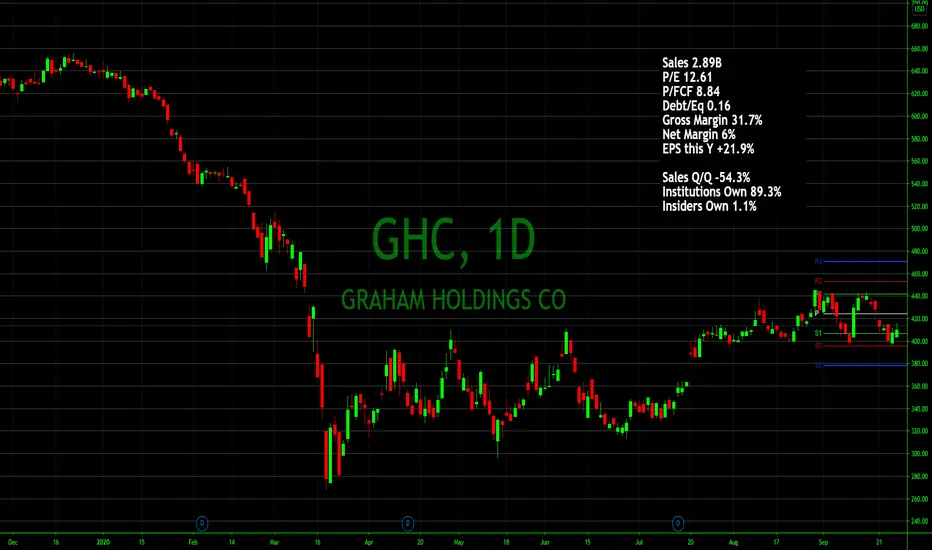
GHC in a long-term uptrendNobody talks about GHC, but that's alright. Take a look at the weekly chart dating back to 2013. The ascending trendline has never been broken, and I don't think it happens here either. Doesn't mean you shouldn't keep a relatively tight stop, however.


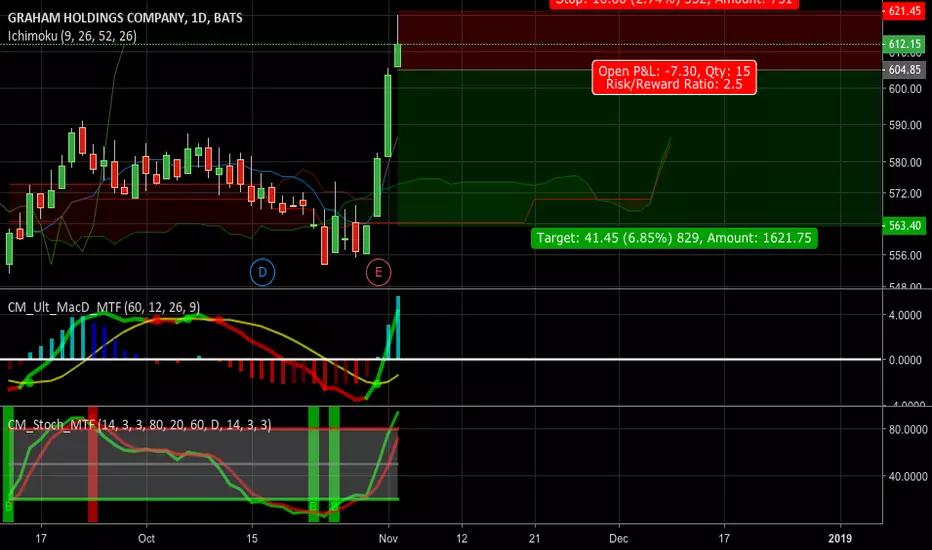
Sell GHCGreen shoot star at the top
See Gap red hammer on 4 hour
Volume very low on lower time frames, suspect
Note: Director sold 1100 shares on 10/9/18... Why?
Insider selling is always a clue/hint
Stoch in oversold area, no confirmation yet ;)
S/L
T/P 586.05 (fair value per Tenken san)
T/P 563.90 (gap til fill 10/30)
R/R 1.01
R/R 2.5
Profit Trading
GHC: Sort opportunityAn intraday high potential, Back Tested Sort Analysis.
We ll try to enter into the correction of the uptrend movement.
DETAILS ON THE CHART
NOTE: Entry range area above the entry point, is calculated upon 80% of the recorded pullback back tested past performances
DISCLAIMER: This is a technical analysis study, not an advice or recommendation to invest money on.

Graham Holdings consolidating This pattern cannot continue, It Graham has been consolidating since December. Rising base looks like it will break upward.
