My next buy zoneBear flag target lines up with the latest 1W/1D demand zone. A dip in this area and I will buy more calls.
GME trade ideas

Stock Of The Day / 03.27.25 / GME03.27.2025 / NYSE:GME #GME
Fundamentals . The company announced a plan for a private offering of $1.3 billion in convertible senior notes, aiming to use the proceeds for general corporate purposes, including to invest in Bitcoin.
Technical analysis.
Daily chart: Downtrend. We mark the 4-month low - level 21.56.
Premarket: Gap Down on increased volume.
Trading session: The price began to tighten to the level of 25.0 from below after the initial downward movement at the beginning of the trading session. The price finally breakouts the level at 10:46 and consolidates above the level after several unsuccessful attempts. However, there was no upward momentum and the price returns and holds below the level of 25.0. We are considering a short trade to continue the downward movement.
Trading scenario: #pullback along the trend (#false_tightening) to level 25.0
Entry: 24.89 when exit down from the trading range below the level
Stop: 25.21 we hide it behind the high of the tightening structure and behind the round number 25.20
Exit: Close part of the position at the price of 24.03 when the structure of the downtrend is broken. However, then the movement continued. We can hold the remaining part of the position until the strong daily level of 21.56.
Risk Rewards: 1/6 (1/10 maximum)
P.S. In order to understand the idea of the Stock Of The Day analysis, please read the following information .

GameStop Stock Holds 11% Gain Following Earnings ReportThe stock price has surged rapidly, nearly reaching the $30 mark, after a strong bullish shift emerged following the company’s latest earnings report. At first glance, the results were mixed: sales came in at $1.28 billion for Q4 2024, down from $1.8 billion in the same quarter of 2023. However, net income held strong at $131 million, compared to $63 million a year earlier. This disparity in results created volatility in the stock price. Adding to the bullish momentum was the announcement that GameStop plans to sell assets to create a strategic reserve in Bitcoin, which helped fuel the rally in recent hours.
Breakout from Bearish Channel:
The stock had been trading within a downward channel since early January, but recently broke out with a strong bullish move. The speed and strength of this breakout may lead to short-term selling corrections as the price stabilizes.
RSI Indicator:
The RSI line is now approaching the overbought zone around the 70 level. As price action continues at these levels, the market may be showing signs of imbalance due to excessive buying pressure, which could open the door to bearish corrections in the upcoming sessions.
Key Levels to Watch:
$31: A nearby resistance level, marking the highest price zone reached earlier this year. A sustained break above this level could trigger a strong short-term uptrend.
$25: A support level aligned with the top of the previous bearish channel and the 61.8% Fibonacci retracement. This could act as a tentative area for a short-term pullback.
$19: A distant support level, corresponding to the lows from September 2024. If selling pressure brings the price back to this level, it could reactivate the broader bearish channel seen in recent weeks.
By Julian Pineda, CFA – Market Analyst

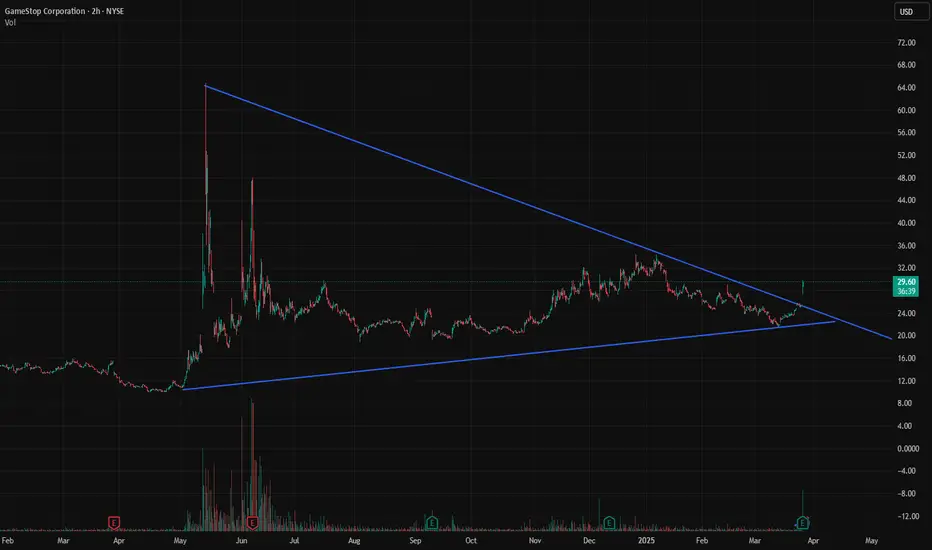
GME Break to the Upside on 2h ChartGap up on open also coincidently triggering a break with significantly higher volume to bring GME out of its volatility funnel and potentially to $80+
GameStop GME Long - Plans to Buy Bitcoin Treasury $4.75 billion News release stating that GameStop plans to buy Bitcoin as a Treasury Reserve Asset, with a note that the company currently holds $4.75 billion in cash.
HA HA HA we will see more companies follow suit.
Initial Target Range: $80-120
2nd Target Range: $200+
Bullish GME.

Gamestop ($GME) Surge 16% in Premarket Amidst Earnings Beat The shares of GameStop (NYSE: GME) surge nearly 17% as the firm reported fiscal fourth-quarter results, which saw revenue fall 28% year-over-year to $1.28 billion.2 However, adjusted net income rose to $136.4 million, or 30 cents per share, from $67.7 million, or 22 cents per share, a year earlier. The earnings growth came as the company moved to cut costs.
GameStop (NYSE: NYSE:GME ) updated its corporate investment policy to include Bitcoin, sending shares higher in extended trading Tuesday.
The video game retailer said its board unanimously approved the decision to add Bitcoin to its investment policy, following reports last month that the retailer was considering investing in cryptocurrencies.
The announcement follows speculation about GameStop's crypto plans after CEO Ryan Cohen last month posted a picture of himself with Michael Saylor, cofounder of Strategy (MSTR), the largest corporate holder of Bitcoin formerly known as MicroStrategy. The price of Bitcoin was just under $88,000 in recent trading.
Shares of GameStop jumped more than 6% in after-hours trading Tuesday following the announcement. The stock was down about 19% for the year so far through the market close.
Where's GameStop Headed? Is there a future?Will the future revolution be tokenized? Is this a dying retail company headed for certain doom?
Seems Ryan Cohen has managed to turn around this company and the launch of GameStop NFT Marketplace trademarked under: "GMerica" The company is also now debt free and C is finding ways to take care of employees as well as bring value to GME
How does the market feel about NFT?
NFT - "Non-Fungible Token" which are unique digital identifier that cannot be copied, substituted or subdivided. Everything is recorded on blockchain used to certify ownership and authenticity.
- Transferable proof of ownership.
Potential Applications:
- Art
-Games
-Music
-Apps
-Movies
-Books
-Tickets
-Stocks - Potential to fix problems with Wallstreet. Can future trading be done on blockchain?
-Authentication
-Counterfeit protection
-Asset titles
- Loans/Mortgages
- 100% verified ballot voting
Let's take a look at the Elliott Wave Analysis:
Have you DRS'd?

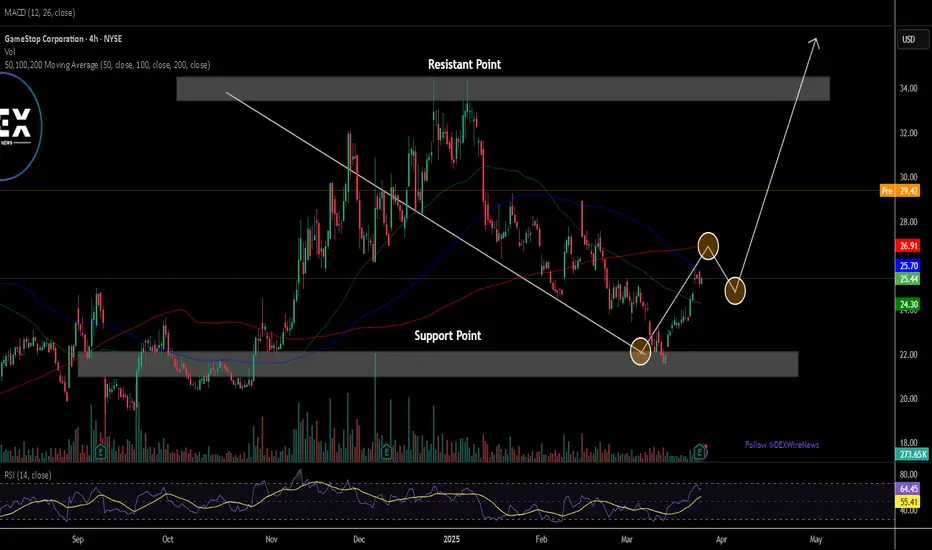
GameStop Corp. (NYSE:GME) to add BTC as a Treasury Reserve AssetThe price of GameStop Corp. (NYSE: NYSE:GME ) shares saw a noteworthy uptick of 7% in Tuesday's after hours trading, primarily based on the news that the firm is set to add Bitcoin as its Treasury Reserve asset.
The asset bounced from it's psychological support zone aiming for a move to the $35- $40 price point. This move would be feasible if GameStop Corp. (NYSE: NYSE:GME ) shares break pass the $30 resistant point.
In light of that manner, GameStop Corp. (NYSE: NYSE:GME ) also is set to announced earnings report Tuesday, March 25, 2025, after market close.
About GameStop Corp. (NYSE: NYSE:GME )
GameStop Corp., a specialty retailer, provides games and entertainment products through its stores and ecommerce platforms in the United States, Canada, Australia, and Europe. The company sells new and pre-owned gaming platforms; accessories, such as controllers, gaming headsets, and virtual reality products; new and pre-owned gaming software; and in-game digital currency, digital downloadable content, and full-game downloads.

$GME - More of the same weird stuffHi all,
More of the same weird stuff where GME has been showing signs of wanting to spike for quite some time now. Generally last week and especially on friday it showed parabolic upwards spiking which usually happens when a move is imminent.
If i was my old degenerate self, i'd be buying out of the money calls expiring this week, and i might just do that.
I don't have a perfectly locked on AI model for GME yet so i don't know for sure yet what's going to happen. My model is okay but not perfect, last i have is a signal from the 11'th saying to buy 22.5 Puts and although that trade did win temporarily by dropping GME to 21.90, GME is now at 23.00 so yeah... needs a bit more time to train.
Will update if i see signs of rejection/even more likely to pump.
No idea when it will pump but due to the parabolic way the data is moving, it usually means the move is extremely imminent e.g day/days less than a week etc.
Lets see. Will update once i have more.

Know it's earnings, but TA beyond cons and a beats fills gapAfter the gap is filled (27), we should see a swing movement back towards the current trend levels. The only object in the way of bearish sentiment is likely the catalyst to exceed expectations, which could be short-lived. Either way, we expect a bullish session only to concede to the continuing pattern of a downtrend swing into the teens. Very cautious!!!

GME Potential Pump to $180GME on the monthly chart is retesting support. It has a good chance of getting to $180 or so unless it breaks down here.
If it starts closing above 180 then it can go a lot higher. Very risky, and not financial advice.
Based on the chart pattern, I will not be surprised to see roaring kitty come out of hiding and posting something soon.

MOASS: WC: 24.75 Target: 1800-2400 MOASS: 47k-100KTopics:
Synergy
Price Structure
28 Level
Next Targets and Sentiment
Indicator Check
MOASS: 06/09 - 07/09 with a curtain call first week in Aug

A little hidden bull on the daily...Suggests that we could see a quick move to the upside. The fractal overlay, refit, looks right from a timing perspective. The 39.56 area is the next upside fib target, so I will be looking for a breach to determine whether to re-strike this level on a retrace.

MOASS: WC: 23.05 Target: 1800-2400 MOASS: 47k-100KTopics:
Market Weakness, Strength & Synergy
Shorts Covering- what levels and why
Runup to earnings and into 04/20
Indicator Check
MOASS: 06/09 - 07/09

$GME
#GME
NYSE:GME
It appears to me from the chart that it is a corrective wave B pattern of a zigzag correction

GME Entering Pre Sneeze (Round 2)A few years back, I traded GME based on the 741 theory left behind by RC and RK. I traded 741 trading days from the start of the purple box (June 2021)
It placed me at April 2024, so I waited and purchased my shares then.
Recently, in June 2024, RK released his SEC Chewy Filing (Likely trying to say look back at the month June - its a stretch but just hold on)
I decided to look back and count 741 trading days from the first purple box, starting at October 2016. It placed me at August 2020. Take a look at August 2020 candle and April 2024 candle, and the candles leading up to it.
So October and June both are the start of what is likely 3 year swaps. This means if RK decided to mess around with Chewy, then he forced hedgefunds to enter another 3 year swap with these stocks, forcing another sneeze waay down the road.
Back to my weird old 741 method as the first time through was simply luck combined with watching pressure over time. So I decided to truly look further into why this 7-4-1 and "35 minutes ago" kept appearing in RC and RK's tweets.
Since RK's Return, i've been watching the monthly chart and counting the months from 0-7, 0-4, and 0-1.
i.e., May = 0, June = 1, and so forth.
May to December = 7 Months
December to April = 4 Months
April to May = 1 Month
Damn that looks like its all Green Candles on those months... But what about April and May?
Well, lets go backwards to go forwards right?
Lets take a look at pre sneeze leading up.
September to April = 7 Months
April to August = 4 months
August to September = 1 Month
Wait a minute, are those all green Candles again? And before a Sneeze??? Can't be...
If projected forecasts are correct, and if DFV does make his return, then I believe we entered the pre sneeze faze last year when DFV returned.
He was trying to tell us something.
IF were in the pre sneeze faze which would bring the price back to the $80 area for a 3rd retest, then you can see where the next few months after lead.
It will break that retest with the help of a little kitty.
That's when shit gets frisky again.
Keep an eye out, collateral is drying up and the shit winds are blowing it away.
Edit: The Purple Box contains 35 bars from the start of the box to each bottom before a sneeze, followed by 17 bars of sneezing
As in Ozymandias did it 35 minutes ago.

MOASS: WC: 24.00 Target: 1800-2400 MOASS: 47k-100KTopics:
Market Uncertainty & Selling
Price Structure
Next Major Targets
Significance of 1800-2400 area
Indicator Check
Blue Lines
March 10th & Dotted Lines
Next Week
MOASS: 06/09 - 07/09
A Reckoning is Coming :)

$24.37. The level to hold. Massive pump incoming.This is the level to hold. Huge pump is going to happen today. It's time.

GME about to run upAfter getting pummeled since the start of the year time for NYSE:GME to run up once again, friday we will end around 24 just to breakout on monday

MOASS: WC: 25.04 Target: 1800-2400 MOASS: 47k-100KTopics:
Market Uncertainty
GME Price Structure
Near Term Targets
28 Level & GME Structure
Quick Indicator Review
SPX & Markets
The Cats Tweets
MOASS: 06/09 - 07/09
Good trading to you all!

GME. $24.37 is the bottom. We front ran $24.37 before the pump the last couple weeks. The pump was a fake out because we need to test $24.37 before we can pump. Source. Trust me bro.

MOASS: WC: 26.42 Target: 1800-2400 MOASS: 47k-100KHighly suggest you listen to the whole video
Topics:
Oct 21st
Why price is consolidating
The importance of the VWAPS on the chart
Feb 28th
Next targets

GME from 32$-26$ ( FTDs )Hi everyone
Sharing a not that the GME stock in the past months drop from 32$ to 26$ in week, and if you look at the FTDs in this days you will find it (-) no reporting until today.
Thats mean many things about (MOASS) and (Short)…
Let us see in the coming days what will happen for this stock.
😉 Good Luck
