HAE (Very bullish)
I see a big oppertunity in this stock.
The cash per - employ is risen to a very high level.
The stock has positive earnings.
Stock has some momentum.
HAE trade ideas

HAE longThis set up looks really bullish. will be playing both gaps to the upside. $80c 3/18/2022 @3.85 could pay big time.


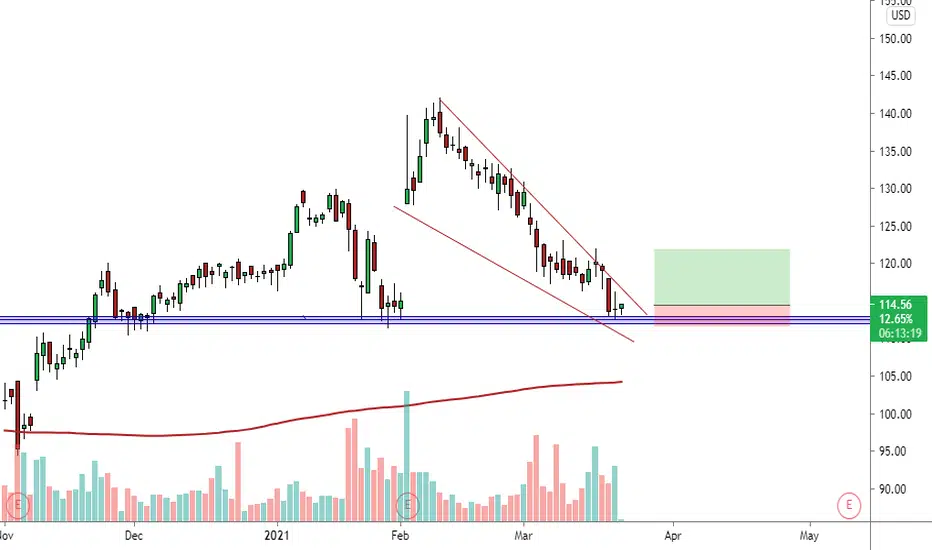
$HAE long$HAE forming a falling wedge approaching key support with RSI divergence on major timeframes, looks due for a bounce here. I like entry here with tight stop, 1 or 2 month time at least.
Haemonetics Receives FDA Clearance For NexSys PCS® With Persona(HAE: Haemonetics Corporation
2020-10-03 20:36:00
Haemonetics Receives FDA Clearance For NexSys PCS® With Persona(TM) Technology

HAEMONETICS! Haemonetics may correct at $100.80. In the long term, it will grow after the correction.


Haemonetics Reported First Quarter Fiscal 2021 Financial ResultsHaemonetics Reported First Quarter Fiscal 2021 Financial Results
themarketsignal.com
RSI of Haemonetics Corporation (NYSE:HAE) is 19.96 and the stock looks bullish. The company reported financial results for first quarter of fiscal 2021. In Q1-21 the company reported $196 million revenue, decreasing 18% from a year before. There has been a 16% organic revenue decline. The earnings per diluted share in Q1-21 came in at $0.21. During the first quarter of fiscal 2021, the adjusted earnings per diluted share came in at $0.46.
The company generated $12 million Cash flow from operating activities during the first quarter of fiscal 2021. Free cash flow before restructuring & turnaround during the reported quarter came in at $11 million.
The company also reported 46.0% gross margin in Q1-21, down 260 basis points in comparison with Q1-20.

HAE Shortbroke below daily support at 83.27, target 3/20 low (took position thinking i'd target the 3/18 low, but when looking at when i got home see that has such a long wick i think it's a stretch). SL just above the ~87.05 level that provided support over the lsat month


HAE. Price near support line$HAE - HAEMONETICS CORP. Engaged in blood donation activities. On the daily charts, the paper has reached a good level of support at $83. Starting from 19.06 the volume is significantly above the average, the RSI indicator came out of the oversold zone and shows a buy signal on the daily timeframe. The indicator ADX also came out of the trend-free zone. When buying at current prices, stop below 83. Target 1 - $103-105 (around EMA 100 on the day timeframe), Target 2 - $110-$112, in the downtrend area. The negative news that 2 management employees sold their securities during the last week. CFO for $2,018,326.98 and VP Dan Goldstein sold 4,456 shares.
All information in this post is my private opinion.

Update on HAE Looking at my old idea which is still in play, you can see legs B,C, & D form a kind of falling wedge. And we are about to break out one way or the other! I bought my call yesterday when the price was down around $83.40 good luck traders!

Haemonetics Corporation HAE reversal zone & Bullish Bat Been checking out the charts on HAE and looks like we could be in a potential reversal area. From our low in March to our top in April we've reversed to the golden pocket between 61.8% and 78.2%. Now for the Bullish Bat just using the candle bodies to me seems the best because leg B hit the 50% Fib line pretty perfect and thats what you want. As you can see theres still room to dip lower on leg D to hit the 88.6% Fib. But if bullish enough we could start to reverse here. Can see a little bullish divergence on 4hr RSI and MACD
Theres also bullish divergence on the 1hr RSI and MACD.
Now with that said here we have the potential Bullish Bat using the wicks and can see theres still a little ways to go until we get close to the 88.6% Fib line.
Me personally prefer the chart without using the wicks because
1. We hit the 50% Fib perfect
2. Looking back stronger support areas are between $80 & $83
So I believe safest entry targets to be between $79.40 & $83 and stop loss below $74. One could argue now is a good point of entry I'm thinking of entering after waiting to see what the market does in the first couple of hours all depends on your risk tolerance.
1st Target: $95
2nd Target: $100
3rd Target: $105
Thinking of buying the $90 call option exp. 9/18
Good luck and happy trading

Once breaks down, target is 77-781. it's at a support area .
2. Once it breaks down, the length of the downtrend would be twice of the length of previous uptrend(it's 12.75 points as shown in the chart),
so the length might be around 25 points, between 77 and 78.

HAE LongHi traders,
We have an opportunity with stock HAE to go long, this stock is in a strong uptrend, and after a retracement could go up again….
Entry at break of previous candle at 110,60
Stop at 105,95
Take profit 119,90
This trade offers risk reward 1:2
Good trading!
Xavi.

