ICICI BANK MONTHLY BEARISH DEEP CRAB Earlier this Pattern given good reaction on Type1 entry & Hit TARGET 1 ,now price again came into PRZ Zone of Pattern it becomes a TYPE2 Entry which is REVERSAL
Horizontal BLACK DOTTED lines r High & Low of ULTRA HIGH Volume CANDLE .Vertical dotted line is ULTRA HIGH VOLUME i.e SMART MONEY .ULTRA HIGH VOLUME for going SHORT confirmation need with LOW VOLUMES in the area of ULTRA HIGH VOLUME BAR i.e when NO DEMAND(volume lower than previous 2 candles)appears with RSI BELOW 70
POTENTIAL SELL
IBN trade ideas

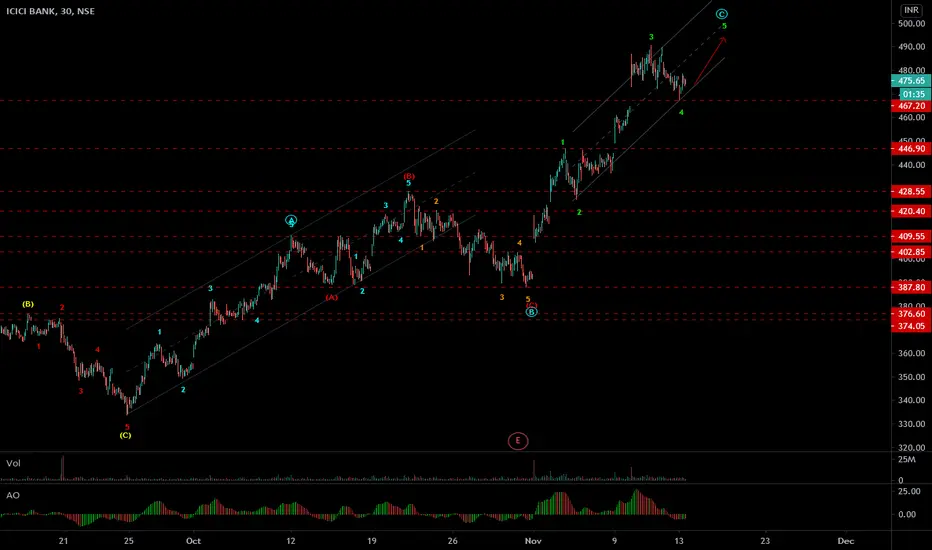
ICICIBank - Elliott wave analysis - about to reverse Icicibank is in 5th subwave of final 5th wave up, which about finish soon. Sell below 499 for target below 470 after completing the cycle.


ICICIBANK - Bull Flag formation- Intraday/Short Term TradeThis analysis is purely based on price action and Chart Patterns.
The analysis is on 15min TF hence target can be achieved in intraday trade or in couple of days
Trade logic with SL and Target is explained in image itself.
Don't chase the price.
Always plan your trade & trade your plan
Check the idea of ICICIBANK Bull Flag Pattern Breakout on Daily TF linked below.
Keep trailing SL accordingly once entered into the trade.
Trade at your own risk and money management. Do your own study before taking any trade
Feel free to comment for any queries & suggestion

ICICI BANK- Dec viewIf Monthlly resistnance is broken furthur long untill R2.
If not Possibility of reaching Monthly CPR Levels


Icicibank - Bearish BatIcicibank near to PRZ of bearish bat on weekly TF and also has 2 supply zones above, Hard time for icicibank. Lets see how price react at PRZ...


HEAD & SHOULDERS + ELLIOT CORRECTION WAVE IN ICICI BANK POSSIBLE SHORTING OPPORTUNITY IN ICICI BANK WITH THE ABOVE STATED PATTERNS.
NOTE : POSSIBLE NOT GUARANTEED*
ALTHOUGH I AM ALREADY LONG IN ICICI BANK, IN CASE THE BULLS LOSSES THE BATTLE, I KNOW BY HOW MUCH IT GONNA MAKE A POSSIBILE DIP SO I AM CALM AT THE MOMENT :D


ICICI Bank - BearishICICI Bank CMP - 476.70
Looking bearish in higher time frame. One can go for Intraday / Swing trade setup with the following entry, exit & targets
Sell at or Below ONLY 471 / Stop Loss 479
Target 1 - 468
Target 2 - 465
Target 3 – 462 / 460
Disclaimer: This is my view and for educational purpose only.

ICICIBANK - Elliott wave analysis - 5th wave upICICIBANK - it is in 5th internal wave of C up. stop loss is 467.10 target will be above 492 or higher.