ascending triangle breakout #ICICI bank as you can clearly see the ascending chart breakout pattern . for this , i reoly on 4 point theory ie At least 2 points are required to form a trend line and 2 trend lines are required to form a symmetrical triangle. Therefore, a minimum of 4 points are required to begin considering a formation as a symmetrical triangle. The second high (2) should be lower than the first (1) and the upper line should slope down. The second low (2) should be higher than the first (1) and the lower line should slope up. Ideally, the pattern will form with 6 points (3 on each side) before a breakout occurs.
IBN trade ideas

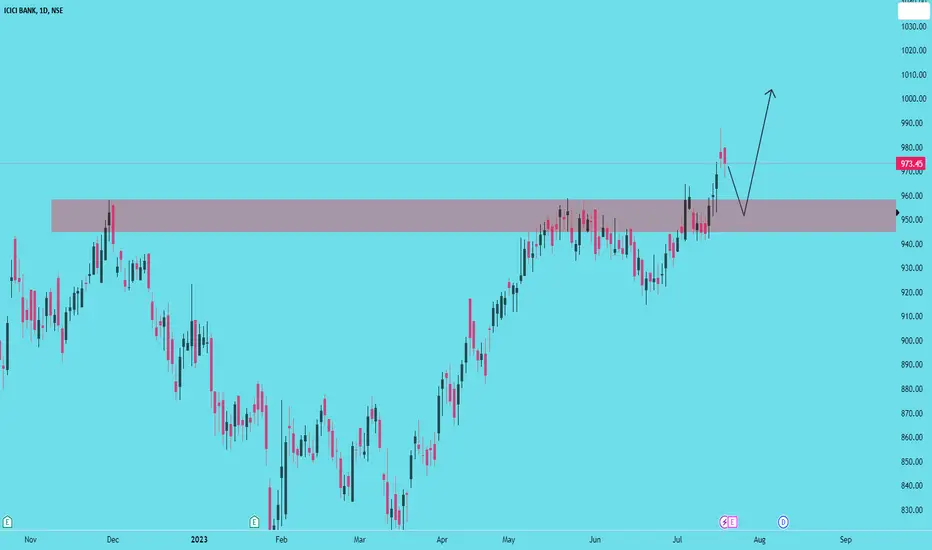
ICICI BANK ( Swing Trade)
Price is currently rejecting from its demand area i.e 950-960 which is aligning with fib retracement levels 0.5 and 0.618 respectively.
The prices is forming inverted H&S pattern and taking support on trendline as well giving some extra confluence to our analysis.
So we can expect some bullish price action in coming trading sessions.If price comfortably breaks and close above 975 ,we can probably see new all time high till 1055. Other targets are mentioned in the charts.
If price fails to break above 975 and slips below 950 then it can further falls till its support ie. 935 or 915.

ICICIBANK DAILY (classic textbook triangle pattern) BREAKOUT ICICIBANK DAILY (classic textbook triangle pattern) BREAKOUT
ICICIBANK DAILY CANDLE CHART READING AS TRIANGEL PATTERN BREAKOUT
its a clear classic text book triangle pattern breakout
AS we can price trading in a triangle for around 3 months
and now its breakout of trangle @ 868
after breakout of triangle it come back and retest the breakout level
and holding safe the low of breakout candle
so its a pure buying idea for me
with the stop loss of 840 on closing basis
and the target for 980

ICICIBANK--Near its trendline??the stock is near its trendline break...
today a strong bullish momentum is observed in this stock....
Rally base rally is observed from 965-962 zone...tomorrow if this zone acts as price is bullish...
this time will breaks the trendline and moves higher...
liquidity also lies above these zones....
Go for long in this stock...

ICICIBANK Buy after Bounce BackThis is time to wait and monitor the price of ICICIBank and you can buy this stock for intraday at 963.60
This is my analysis based on the price action and chart pattern.
Thanks for supporting me. If you like this idea then you can show your love by commenting on this analysis.

ICICI BANKICICI Bank is a large private sector bank in India offering a diversified portfolio of financial products and services to retail, SME and corporate customers. The Bank has an extensive network of branches, ATMs and other touch-points.
Company is expected to give good quarter
Company has delivered good profit growth of 34.6% CAGR over last 5 years.
its profit has been doubled almost 2 times in last 2 years.
IT HAS FORMED REVERSE HEAD AND SHOULDER PATTERN IN 1 DAY CHART
CURRENT PRICE-973
TRAGET PRICE-1114

ICICI BankExpect ICICI Bank to outperform in near term. The sector has strength and the stock is also showing strength hence look for low risk entry point here.

ICICI bank26/08/2023
ICICI bank
CMP:970.40
Break out
Target :1050-1130
SL:945
Information is only for study purpose

ICICIBANK--Long to Bearish Gap ??The stock is trending downwards....
price is now near to a strong, a strong rise is observed from this area..
If it is a bullish turn price will take the support from this area... then look for buy side....
If this area pushes the price upside...we will on long side until the Bearish Gap be filled.
again will look for sell at Bearish Gap or trendline. Look for buy up to 970 and 980 levels.
Mean while it will also test the trendline again.
Keep safe.......

ICICI BANKICICI Bank is near the support level and at attractive support level. Both on DAILY and WEEKLY chart it has shown a DOJI CANDLESTICK and also given its breakout.
HARDLY 20 POINT STOP LOSS I.E 946 AND GET READY FOR NEW ATH

ICICIBANKNSE:ICICIBANK
One Can Enter Now !
Or Wait for Retest of the Trendline (BO) !
Or wait For better R:R ratio !
Note :
1.One Can Go long with a Strict SL below the Trendline or Swing Low.
2. R:R ratio should be 1 :2 minimum
3. Plan as per your RISK appetite and Money Management.
Disclaimer : You are responsible for your Profits and loss, Shared for Educational purpose

long term bullish on ICICI BankI spot a clear 5 wave structure since March, 2022 lows.
Clearly indicating that there is more upside in the coming months.
A very simple and clear structure in my opinion.

ICICI Diagonal PatternA wedge or a diagonal pattern generally signifies dramatic reversals.
Do Well Analysis Before Investing.
For Educational Purpose

icici bank is now boosting for a Rideicici bank is ready for big move of approx. 18 percent
RSI is also supporting it
after the successful breakout of the cup and handle pattern
it is now retesting it and ready for the big move.
buy - 970
SL - 950
Target - 1000 , 1120
Amazing Risk reward ratio - 1:10

Technical and digital analysisWe notice that we are in the process of a correction for the ascension, and there is an increase in the buying momentum, and we wait for the selling momentum to weaken in the correction, and we buy and there is divergence

Bullish ICICIBANKSee in Chart friends..
Head & Shoulder Patter and above horizontal line (major resistance) around 960.
So if cross, stable and close above 960, shooting UP..
Let's see

ICICIBANKICICIBANK Chart Analysis.......24/07/23
ICICIBANK Long - 1002
Sl - 988
Target - 1010 / 1030 / 1050
Enjoy !


ICICI Bank is Retracing and can be Shorted 26/02/2021this tikker seems to me overvalued and retracing from its ATH, as we can see there are many reasons to believe this stock is falling and will correct some of its rally and make the infrastructure for its upcoming rally.
we can see there is a Mild Bearish Divergence on MACD and Regular Bearish Divergence on MACD Histogram, which are the sign of trend reversal and retracement.
MACD and Signal lines are over crossing from top which is again an other sign of overbought and shall distribute some volume which will cause the trend reversal and surplus of supply and price correction and fall.
as we can see the price was ranging in an ascending Paralel Channel and it has already tried to break above the top boundary but could not hold the bull run and fall drastically with Big Red Bearish Candles, which is again another confirmation for the Bearish Divergence and trend correction or retracement.
there are total of 3 TP for the retracement which are having confluences with Fibonacci retracement golden Zones 38.2%,48.6% 61.8% Levels, amd past Support areas.
obviously after this retracement we should look in to the market sentiment in order to decide about the longing or rebuying it but yet there are good chances that there would come some packages from the RBI to infuse some blood to the banks wanes and pump them back up and make the new ATH where it can be 127% and 161.8% of the same fibonacci expansions.
the other scenario after the retracement can be a renge and the fall more as we can see the Cryptocurrencies are growing heavily and of course their growth is very dangerous for the centralized banking system and soon these systems are going to loos the battle to the crypos if they don't adapt a survival mechanism on time for saving some time and loses and it can be an end if the prices fall below the red accumulation zone...
please comment you opinions about this analysis

ICICIBANK Analysis ??ICICIBANK broken the monthly resistance @960 zone.
In weekly time frame also its bullish...
in daily time frame showing bearish pressure....
in lower time frames it is coming slowly to test the previous resistance might acts as support.
ICICI Bank very bullish with cup nad handle pattern Good sign of bullish trend in ICICI Bank. Trend will break up resistance and give target up to 1100

ICICIBANK - Targets and CorrectionICICBANK is completing an ending diagonal pattern which suggests that prices could reverse soon as a part of correction. Further confirmations can only be made after price breaks the structure (downwards).
This is only an idea based on the Elliott Wave Theory. Manage your own risk while trading or Investing.

ICICI Bank: The new leading bank?A close above 959 is required with good volumes, this will confirm a Cup and Handle BO. First 990 then 1150.
