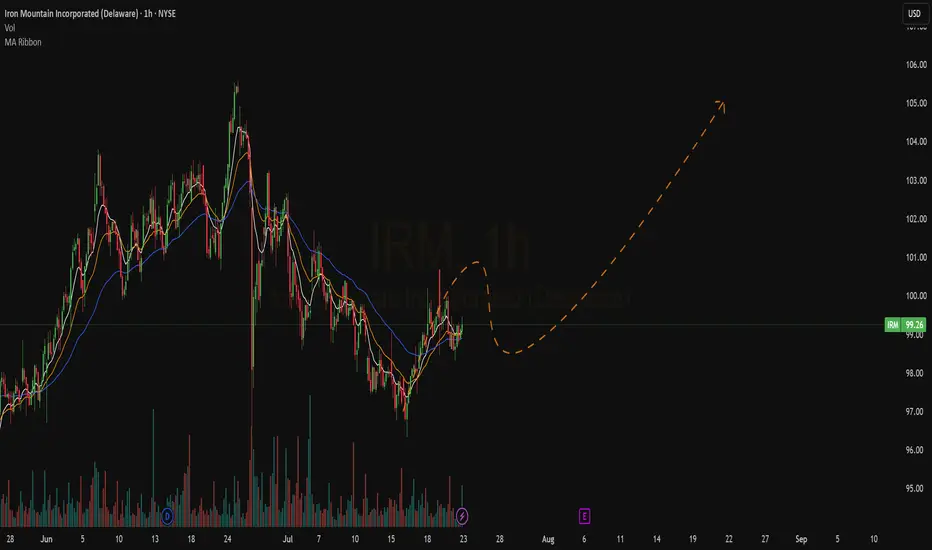
Quick View : IRMBullish crossover, pullback on the ema 50 while all the other EMA are in a bullish scenario RN.
Looking for a new higher high after the last ATR break.
Ready To Catch IT
IRM trade ideas
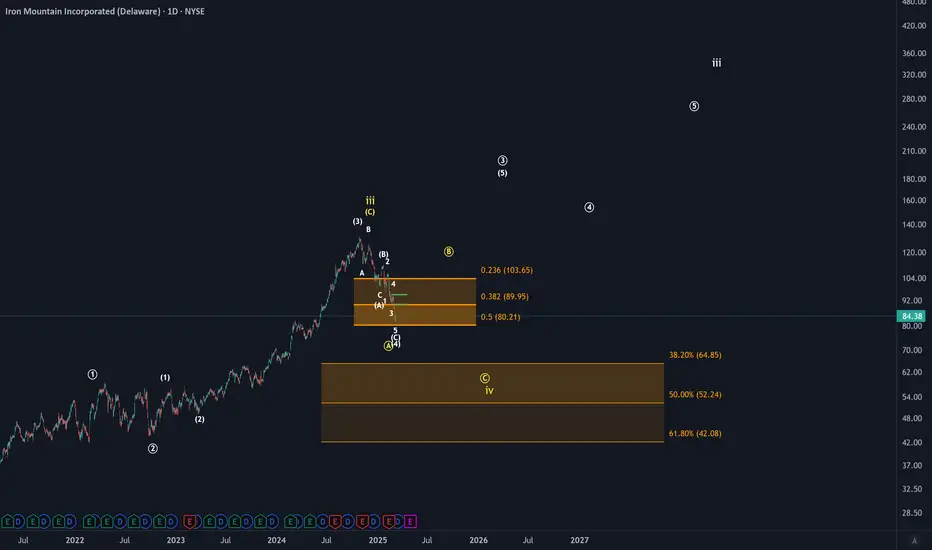
IRM Stock: Important Support Level Reached! Elliott WaveOn the IRM chart, I'm currently tracking a potential bullish impulse unfolding, represented by the white scenario. According to this white scenario, we're in a fourth wave pullback within a larger third wave. However, it's critical for the price to remain above the $80 level; otherwise, the pullback would become too deep for this scenario to remain valid.
Alternatively, there's a broader wave-four correction underway, indicated by the yellow scenario. In this alternative perspective, we have deeper support levels at $64.85, $52.24, and crucially at $42. Although ideally, the price should hold above $42, technically, a diagonal pattern (which the yellow scenario would suggest) allows a deeper decline down to the 61.8% retracement level. The area around $42 also aligns with structural support.
On a shorter time frame, the price has reached the 50% retracement within the upper support area, and we now have enough waves to potentially consider wave C of the fourth wave in the white scenario as complete. Still, we'd need at least a break above the $90 level as an early indication that a low has been established. For now, this is an interesting price area to watch closely, but it's still too early to adopt a bullish stance with confidence.
Watchlist: IRM"A true friend is one who helps you overcome your failures, and celebrates your successes"
IRM came up on my stock scanner, so I'm adding it to my watchlist. I got a setup signal(1) and with above average volume(2). Looking to enter long near the close of the day if the stock can manage to close above the last candle highs(3) with a stop-loss below (4) and a price target above(5).

we are ready to see 107 first There are a few factors. Of course, the trendline is going well; however, like everything else, a slight pause is no big deal.

$IRM - volume coming in, no sign of stoppingLooking bullish as ever. MACD completely over extended but the bull flags keep forming on the monthly. Could retest $80 but looks ready for $100 also. Watching this one
Not trade advice

IRM Long Trade Idea🔔 BUY Signal Alert! 🔔
🔗 Ticker: IRM
🌐 Market: US Equities
🔄 Side: Long
⏱️ Type: Swing Trade
🎯 Entry: 78.95
🛑 Stop Loss: 78.11
🥇 First Profit Target: 79.87
🏆 Final Profit Target: 80.73
The CHAMLEO EDGE model uses a proprietary algorithmic program at the pre-market auction to identify potential stocks for each day. The algorithm then calculates where there is strong buying or selling pressure on the stock and sends buy or sell signals.
The signal provides a suggested stop loss price based on calculations that the movement may no longer be valid. It also provides a first suggested level for realizing potential profits, indicating that there is a resistance level just beyond this price that may cause the stock to stop and possibly reverse. If this level is surpassed, there is potential to achieve possible profits at a price better than the first profit level, allowing the possibility of extending potential gains.

#IRM#Fundamental Analysis
Q2 2023 Performance:
The company witnessed a 5% revenue growth in Q2 2023, displaying solid operational performance.
Despite positive revenue growth, the stock experienced a decline on August 3, 2023. However, the overall earnings growth reported over the past year was favorable.
Stock Performance and Investor Sentiment:
Iron Mountain's stock price soared to an all-time high, with the share price hitting a 52-week high of $64.22 on September 7, 2023. This surge reflects the growing confidence and optimism among investors, marking a significant milestone as the company continues to fortify its market position.
Outlook and Predictions:
The average price prediction suggests a potential upside of 9.18% compared to the current IRM share price of $61.67. However, the forecasted Return on Assets (ROA) for 2023-2026 is not available, seemingly lower than the industry average.
Technical Analysis:
The company is currently in a corrective wave phase, with slowing upward momentum on the MACD indicator. The RSI hasn’t entered the overbought zone, indicating that the market has higher expectations for the company. The focal point is on the ending price of the corrective wave C, with short-term wave A ending price anticipated around $56. The first upward target is envisioned around $76. Overall, the company exhibits good performance, and positions can be established for buying above $50.

IRM Breakout 6Month WedgeIRM is about to possibly breakout from a 6 month Wedge.
Trading volume is coming in. Bullish on this one.

Iron Mountain (IRM) Reentry AttemptIRM finally went through the midpoint pivot target. A return to $54.77 would give us a reasonable reentry attempt.

IRM WCA - Ascending Triangle Company: Iron Mountain Incorporated (Delaware)
Ticker: IRM
Exchange: NYSE
Sector: Real Estate
Introduction:
Hello, and welcome to today's technical analysis. We are diving into the weekly chart of Iron Mountain Incorporated (IRM), a Real Estate company traded on the NYSE.
Analysis:
Taking a look at Iron Mountain's price movement, we can observe a series of interesting patterns. The price was initially propelled into an upward trend by an Ascending Triangle pattern and since the breakout from the ascending triangle took place, price is comfortably sitting above the 200 EMA. So it acted as a reversal pattern. This bullish trend was then enhanced by an accelerating trendline.
Following this phase of acceleration, the price entered a kind of sideways trend characterized by a Broadening Triangle pattern. This period of consolidation has since morphed into a new pattern.
For the past 399 days, an Ascending Triangle pattern has been forming. The upper horizontal boundary of this pattern has been touched five times, while the upwards sloping trendline acting as support has seen two touch points.
It's worth noting that the breakout from this pattern may take some time due to the nature of the data interval that we selected, but due to its potential significance, Iron Mountain Incorporated should be closely monitored as a key watchlist candidate, in whichever way it will break out.
Conclusion:
In conclusion, Iron Mountain Incorporated presents a compelling case for a trade candidate, with a second Ascending Triangle forming after a period of sideways consolidation. The significance of a future breakout should not be underestimated.
As always, this analysis does not constitute financial advice. Please conduct your own research and consider your risk tolerance when making investment decisions.
If you found this analysis helpful, feel free to like, share, and follow for more updates. Happy trading!
Best regards,
Karim Subhieh

IRM Dividend CrashIRM is an incredibly stable stock. Even currently as the market is falling IRM is green on the day. However, if you analyze the chart carefully you will be able to see that about a week prior to the dividend ex-date. The stock will fall. It's not a might fall. For the last few years, the stock has gone down in the span of 1-2 weeks. It has also been overbought according to the RSI Chart and is due for a pullback. It is currently pushing higher even when the market is red. I'm no expert, but it has dropped up to 18%. The risk-reward ratio seems pretty solid.

IRM Inverted Ascending Scallop CompletionAn example of an ascending scallop that has completed and moved on to its more bullish phase

IRM - Probably ToppedIRM gap down today to break through trendline and 20MA which has lead to bearish price action previously.
I'm already short this name via LEAP puts as I think this will be a major top. It didn't quite reach my 2nd entry target.
Evening Star top appears also to be a Wyckoff UpThrust with declining volume.
The expanding structure appears to be a wave 4 and if this is a wave 5 completed it will be heading much below.
RSI close to trending in lower quadrant which would be bearish.
Earnings coming up that has had positive reaction previously, however I'm wondering if the trend has reversed also the earnings pattern will reverse.
Not advice.

IRM - EOM UpdateIRM printing a very bearish monthly candle having held up above the expanding channel for most of the month but then collapsing through earnings just as I said it would in the previous thread. Not considering short term shakeouts, IRM had previously seen bullish price action to follow in through the last 4 earnings but here the dominant trend had reversed to the downside and thus the bearish reaction on this occasion.
And so I think that concludes the 5 wave impulse and IRM will now be in an A wave down.
RSI shows plenty of berish divergence highlighting the momentum shift to the downside. And with such divergence I would guess that IRM will hit the lower band before seeing any significant upside price action.
Also declining volume since February shows trend exhaustion.
Expecting price to fall sharply back through $51 where a 1.618 reverse extension has been taken from 2 previous major pivots from 2007 - 2008 crash. I have a 2024 LEAP put bought a bit early at $52, but that is the luxury of LEAPs is you can be early if you are aware of the dominant trend and still land ITM.
I would like to buy back my put at the 0.618 inverted phi retracement @ $35 or the 100 month moving average which has provided both significant support and resistance. Whichever comes first.
Not advice.

$IRM with a Neutral outlook following its earnings #Stocks The PEAD projected a Neutral outlook for $IRM after a Positive over reaction following its earnings release placing the stock in drift B with an expected accuracy of 75%.

Iron Mountain (IRM) ..... A Short Term Peak ??Iron Mountain (IRM) has had a 35% run in 35 days.
I have indicated a Wolfe Wave formation which projects a $48 target in early May.
Overlay this with a Harmonic Crab Pattern which is the basis of forming.
(For purists this developing Crab pattern may not meet their more exacting criteria.)
Additionally the indicator in the bottom panel suggests a forming top and needs to roll over.
Nevertheless I would suggest that around the $59 area if archived, may be a good place to extinguish existing positions or even short.
If this doesn't happen then drive on to another situation ,,, never chase.
That's what I will be watching for to take action on.
I will update this as warranted.
Not investment advice, do your own diligence and respect broad markets and World events.
Good Luck
S.

$IWM D$IRM on the daily looks textbook broadening top. After 12 day rally consolidating just at resistance, can even say this is bullflag. So this is bull and bear, watch for break on either side

IRM - Major Top Completing 🐰IRM looks set for a major collapse here having struck a major long term fib and falling out an ending diagonal to form what is probably LPSY. RSI divergence also confirming top.
This will easily see 200 and 500DMA but I think it will go much further and will hold short positions.
Not advice.

IRM anatomy of a swing tradeIron Mountain NYSE:IRM is a records and information management services company. Its share price has been falling rapidly as of late hence I would like to take the the opportunity to see how I use two of my custom indicators to identify trend changes and adapt accordingly
The daily chart of IRM is divided into 3 parts from top to bottom:
1. The share price
2. A custom bidirectional momentum indicator
As indicated by the green arrows, the latest correction is reflected by the momentum indicator moving in opposing directions at a high angle of attack. (think of the pincers of a lobster).
In general, the greater the gradient and smoothness of the indicator, the stronger the buy/sell signal.
3 A modified stochastic oscillator
Indicator I use to analyze market cycles. Custom period look back and smoothing is applied to represent the accumulation and distribution phases of a market or security. Applied to IRM, the indicator crosses over from its peak at the beginning of Jan 22 and moves downwards.
If we look back to the beginning to December , we can see a similar move to the up side (yellow arrows). These two indicators when combined can work synergistically to provide highly actionable trades on all timeframes.

IRM - Cup & HandleIRM showing a cup and handle pattern. A little late on this one but still means this is showing signs of a solid uptrend. The recent market activity has not been favorable to breakout traders but this setup worked and showed a breakout on 8/31 past the handle on strong volume.
Only bear case here is that it is extended from the MA and would not offer a good entry point at current prices. IMO, everything is over-extended right now but I am keeping this stock on the list of viable candidates once we get a shorter term correction.

IRM - Cup & Handle (Bullish)IRM has just broken up from a Cup & Handle Formation guys! This is a continuation pattern if the trend prior to this pattern was "up". The cup's formation should preferably be at least 1 to 6 months in duration. The "cup" was a mere 23.8% fib retracement of the prior uptrend while the handle was a shallow 38.2 fibonacci retracement from the cup's "rim" both of which are ideal (ie "shallow" retracements).
It would have been perfect if we see a high volume break up as well (not seeing that though). However it is still worth a shot to trade this pattern as it has good risk/reward ratio.
The initial profit target is around $52 (projecting the same distance for the cup's depth of $5 from the rim. Initial stop loss should be placed several ticks below the cup's rim (say 45.90). Trail stops upwards as trade goes our way.
Disclaimer: TA is about improving our odds of a successful trade (not a guarantee). This is just my own analysis and opinion for discussion and is not a trade advice. Kindly do your own due diligence and trade according to your own risk tolerance and don't forget that money management is important! Thank you. Do give me a thumbs up if you agree. Feel free to let me know what you think! :)


$IRM - on replayI have traded options on IRM a couple of times and its now set up for entry again
Oct 15th expiration ATM ($42.50) is looking good to me. Will grab options after the open.
