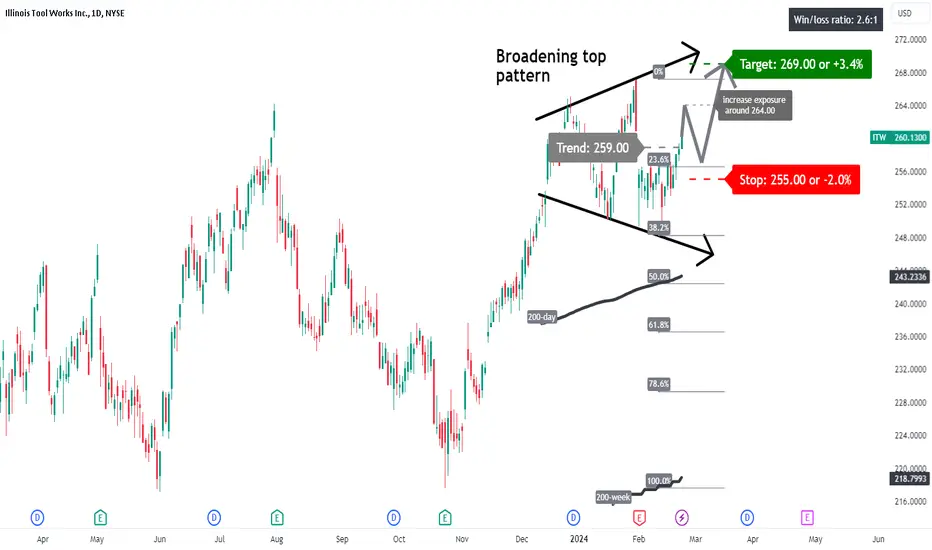
ITW: broadening top patternA price action above 259.00 supports a bullish trend direction.
Increase long exposure for a break above 264.00.
The target price is set at 269.00 (the upper range of the broadening top pattern).
The stop-loss price is set at 255.00 (just above its 23.6% Fibonacci retracement level).
Remains above its 200-day simple moving average.
An incomplete broadening top pattern, characterised by increasing peaks and troughs. This scenario can indicate that buyers are gaining strength and are able to push the price up before the pattern completes, potentially leading to a continuation or initiation of an upward trend in the stock.
ITW trade ideas
ITW looking bullish!ITW is in a daily squeeze that looks primed to fire long. It just developed a fractal double bottom after a much larger double bottom. If it can break the resistance at $264, I think it climbs higher to $283 (the smaller double bottom price projection). It could do this on the strength of the daily squeeze and then, with luck, maybe it'll trigger the montly squeeze to fire as well.

ITW Bull flag formationReasons for bullish bias:
- Price forming a potential bull flag
- Entry is at breakout of pole for further confirmation
- HH breakout will also add confluence
- TP till projection
Entry Level (Buy Stop): 264.22
Stop Loss Level: 249.49
Take Profit Level 1: 278.95
Take Profit Level 2: 293.68
Take Profit Level 3: 300.56

ITW Strong bullish momentumITW has just defined a HL and now going to start its movement up to a very strong resistance level of 266
Entry @ 255
SL @ 248
TP1 @ 263
TP2 (if it breaks above 266 level then just use 260 level as stop loss for the trade)

ITW WCA - Cup and HandleCompany: Illinois Tool Works Inc.
Ticker: ITW
Exchange: NYSE
Sector: Industrials
Introduction:
In this analysis, we are looking at Illinois Tool Works Inc. (ITW) on the NYSE, a noteworthy name in the industrials sector. The weekly chart suggests a possible bullish continuation in the form of a classic Cup and Handle pattern that has been forming for the past 608 days.
Cup and Handle Pattern:
The Cup and Handle is a bullish continuation or reversal pattern that depicts a teacup with a handle on the right side. It's characterized by a rounded bottom followed by a minor pullback, forming the handle.
Analysis:
The previous trend for ITW was upward, which was interrupted by a consolidation phase that materialized as a Cup and Handle pattern, potentially indicating a continuation of the bullish trend. The so-called "lip" or the horizontal resistance of the pattern is at 248.68.
The price is well above the 200-day exponential moving average (EMA), underlining our bullish sentiment. As we observe the current candle's behavior, it appears that we might achieve a close above the lip. A successful candle closure above this resistance could pave the way for a long position.
Conclusion:
In the event of a successful breakout, the price target would be projected at 515.51, corresponding to an estimated rise of about 30%.
Remember, this analysis should be one component of a broader market research and risk management strategy, and it's not intended as direct trading advice.
If you found this analysis helpful, please consider liking, sharing, and following for more insights. Here's to successful trading!
Best regards,
Karim Subhieh
Disclaimer: This analysis is for educational purposes only and should not be considered financial advice. Always conduct your own research and consult with a financial advisor before making investment decisions.

$ITW with a bullish outlook following its earnings #StocksThe PEAD projected a bullish outlook for NYSE:ITW after a negative under reaction following its earnings release placing the stock in drift D with an expected accuracy of 40%.

$ITW with a Bearish outlook following its earnings #Stocks The PEAD projected a Bearish outlook for $ITW after a Positive over reaction following its earnings release placing the stock in drift B with an expected accuracy of 50%.
$ITW with a Bullish outlook following its earnings #Stocks The PEAD projected a Bullish outlook for $ITW after a Negative over reaction following its earnings release placing the stock in drift C with an expected accuracy of 85.71%.

$ITW with a Bullish outlook following its earnings #Stocks The PEAD projected a Bullish outlook for $ITW after a Positive Under reaction following its earnings release placing the stock in drift A with an expected accuracy of 75%.
ITW $ITW High-risk Initial LongITW $ITW High-risk Initial Long. SL and TP on chart. 10-20x leverage. Move SL on TP.

Illinois Tool USA Sun Storm Investment Trading Desk & NexGen Wealth Management Service Present's: SSITD & NexGen Portfolio of the Week Series
Focus: Worldwide
By Sun Storm Investment Research & NexGen Wealth Management Service
A Profit & Solutions Strategy & Research
Trading | Investment | Stocks | ETF | Mutual Funds | Crypto | Bonds | Options | Dividend | Futures |
USA | Canada | UK | Germany | France | Italy | Rest of Europe | Mexico | India
Disclaimer: Sun Storm Investment and NexGen are not registered financial advisors, so please do your own research before trading & investing anything. This is information is for only research purposes not for actual trading & investing decision.
#debadipb #profitsolutions

ITW finally ready to move higher?Note: I've mentioned this stock a couple of times before but both times it pulled back to an expected level due to the market conditions at the time.
* Excellent earnings
* Very strong up trend
* High 3-month relative strength of 2.61 in the Industrial sector
* Breaking out of a ~9 month base with higher than average volume
* Tried to break out a couple of times before but failed due to market conditions at the time
* Now breaking out again with higher than average volume
* The recent price action did make a double bottom and the price has confirmed a break of the double bottom as well.
Trade Idea:
* Now's a great time to enter as the price is just breaking out and is close to the broken level
* If you're looking for a better entry you can look for a buying opportunity near the $242.52 area

ITW looking to reach new hights?* Amazing earnings year-over-year
* Very strong up trend
* High 3-month relative strength of 4.05 in the Industrial sector
* Pays out dividends
* Breaking out of a ~9 month base with slightly higher than average volume
* I mentioned it was breaking out mid November but due to the market conditions it had a slight pull back to the $232.47 area
* It has since regained the lost ground and is making new highs again
Trade Idea:
* If you can stomach a little volatility, now's a great time to enter as the price is just breaking above previous highs.
* It's offering a great risk/reward ratio
* If you're looking for a discount you can do a couple of things
1) You can look for an entry near the $243.47 area as it should serve as support moving forward
2) You can wait a bit more and look for a buying opportunity near the $239.46 area since it would be a stronger level of support and can expect a bounce from there.
Note:
* When looking for buying opportunities at the lower levels you want to wait for a bounce from the mentioned levels before entering.

ITW ready to move higher?* Exceptional earnings
* Very strong up trend
* High 3-month relative strength in the Industrial sector
* Breaking out of a ~8 month base with higher than average volume
* Recently broke above the pivot point of $232.47 and used it as support for 5 days before moving higher
* Retested the broken resistance as support
* Pays generous dividends
Trade Idea:
* Now's a great time to enter as the price broke out and retested it as support
* If you're looking for a slight discount you can look to buy near the $239.46
Notes:
* The general Industrial sector is in a fairly tight range right now so this may follow the same path.
* If you're not getting in right now, you may want to wait a couple of days to see how this plays out.
* If it starts to range, you want to look for a high volume break of the range before getting in.
Caution:
* A daily break below $239.46 would expose $232.47 as support
* A daily close below $232.47 would negate this idea.
* Also if the stock continues to may lower lows for 3 consecutive days below $239.46 you might want to consider exiting the position early.

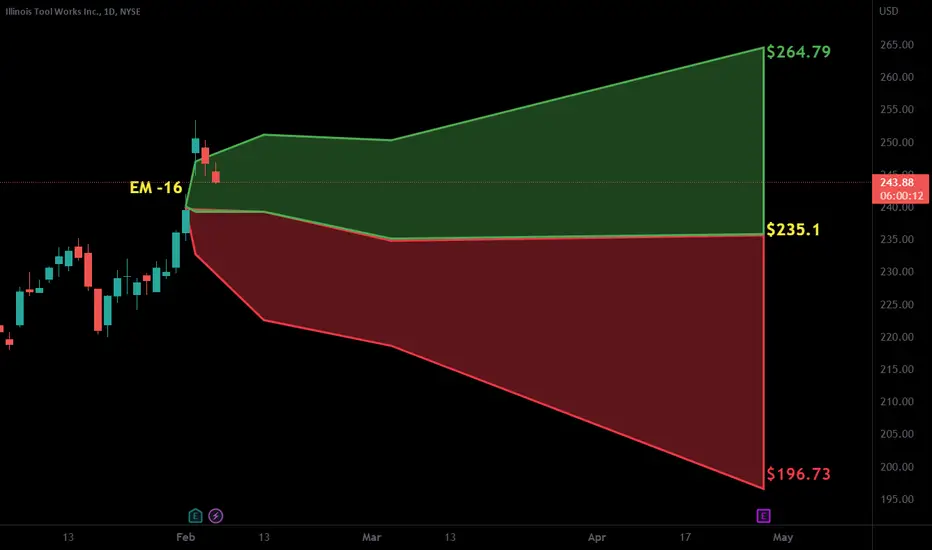
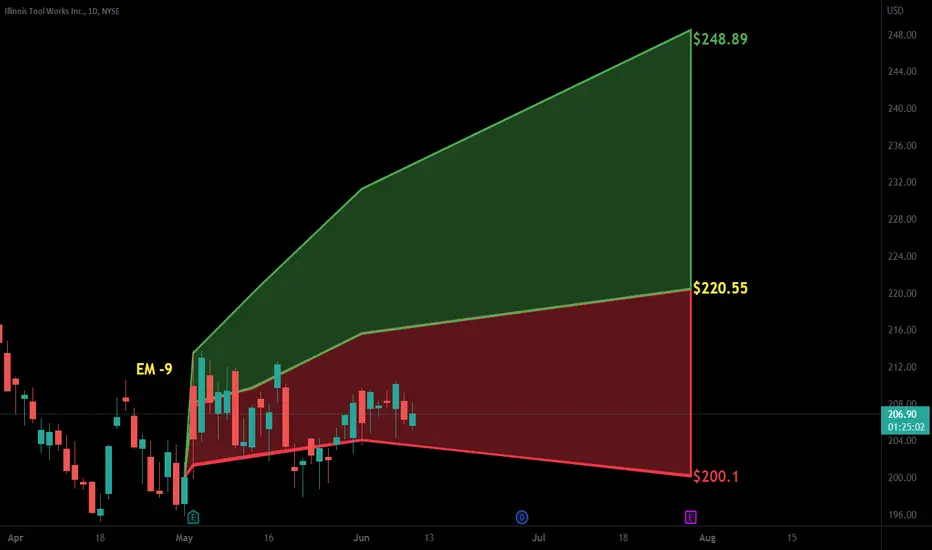
Illinois Tool Works To Buck Trend and Move Up?Based on historical movement, the trough could occur anywhere in the larger red box. The final targets are in the green boxes. The pending top should occur within the larger green box as has been the historical case. Half of all movement has ended in the smaller green box. In this instance, the signal indicated BUY on September 8, 2021 with a closing price of 221.85.
If this instance is successful, that means the stock should rise to at least 223.5 which is the bottom of the larger green box. Three-quarters of all successful signals have the stock rise 2.612% from the signal closing price. This percentage is the bottom of the smaller green box. Half of all successful signals have the stock rise 3.67% which is the end point of the black dotted arrow. One-quarter of all successful signals have the stock rise 5.9855% from the signal closing price which is the top of the smaller green box. The maximum rise on record would see a move to the top of the larger green box. These are the same concepts for the levels in the red boxes as well.
The ends/vertical sides of the boxes are determined in a similar fashion. The peak of the rise can occur as soon as the next trading bar after signal close, while the max rise occurs within the limit of study at 40 trading bars after the signal. A 0.5% rise must occur over the next 40 trading bars in order to be considered a success. Three-quarters of successful movement occur after at least 11.5 trading bars; half occur within 24.0 trading bars, and one-quarter require at least 33.5 trading bars.
The black dotted arrow represents median historical movement. Medians are a good metric, but they are just one of many I use when forecasting future movement.
As always, the stock could decline the very next bar after the signal without looking back (therefore the red boxes would not come into play) or the stock may never decline (and the green boxes may never come into play). The bonus analysis is explained...

$ITW Ready to break nearby ATH?I've been watching $ITW as a manufacturing and infrastructure play. It broke out last week but was unbuyable due to earnings coming up in a few days. Well, earnings are behind and it beat. This is not a growth stock so I doubt it will rocket up. I have an alert set for when it exceeds it's ATH set on the earnings date. I'll wait for that to be taken out with higher than average volume. All TBD. Ideas, not investing / trading advice.
From earningswhispers.com:
Illinois Tool Works Beats 4/30
Illinois Tool Works (ITW) reported 1st Quarter March 2021 earnings of $2.11 per share on revenue of $3.5 billion. The consensus earnings estimate was $1.90 per share on revenue of $3.4 billion. The Earnings Whisper number was $2.07 per share. Revenue grew 9.8% on a year-over-year basis.
The company said it expects 2021 earnings of $8.20 to $8.60 per share. The company's previous guidance was earnings of $7.60 to $8.00 per share and the current consensus earnings estimate is $7.94 per share for the year ending December 31, 2021.
Illinois Tool Works Inc is a manufacturer of industrial products and equipment. Its segments are: Automotive OEM, Test and Measurement and Electronics, Food Equipment, Polymers and Fluids, Welding, Construction Products, and Specialty Products.

$ITW with a Bullish outlook following its earnings #Stocks The PEAD projected a Bullish outlook for $ITW after a Positive under reaction following its earnings release placing the stock in drift A
If you would like to see the Drift for another stock please message us. Also click on the Like Button if this was useful and follow us or join us.

Toolmakers Have High Basing PatternsAttention is shifting toward industrials as technology and the Nasdaq struggle. Two companies in the space have potentially bullish patterns: Illinois Tool Works and Stanley Black & Decker .
ITW is the larger company with a market cap of about $68 billion. It broke out to new all-time highs in August and consolidated for the next seven months. Now the bulls may be ready to return.
First notice the high basing pattern above old resistance. It first held $190 on October 2, turning the pre-Covid peak into a new bottom. It made a slightly higher low four weeks later. ITW revisited this zone in late January, once again making a slightly higher low.
Meanwhile, a downward-sloping trend line took shape – only to be broken at the beginning of March.
Also notice how the 50- and 100-day simple moving averages flattened out and squeezed on either side of the price.
SWK shows similar patterns. It made new highs above $176 in October and spent about six months chopping on either side of that level. Like ITW, it had a descending trend line breakout and a tight squeeze between the 50- and 100-day SMAs.
The fundamental stories for these companies also appear favorable, given the improving economy and prospect of increased infrastructure spending. SWK may appeal to value investors, trading for less than 20 times forward earnings.
TradeStation is a pioneer in the trading industry, providing access to stocks, options, futures and cryptocurrencies. See our Overview for more.


ITW in a Bullish Trend - Buy in Dips Opportunities Illinois Tools Works in a strong bullish trend. However we may see some correction first, and jump again. Looks like a good "Buy in Dip - Swing Play Stock"

Vision for ILLINOIS TOOL WORKSHey guys, ILLINOIS TOOL WORKS is in a very interesting moment, breaking of the support of the stabilization zone. we can wait for a breakout this one to join the one above.
Please LIKE & FOLLOW, thank you
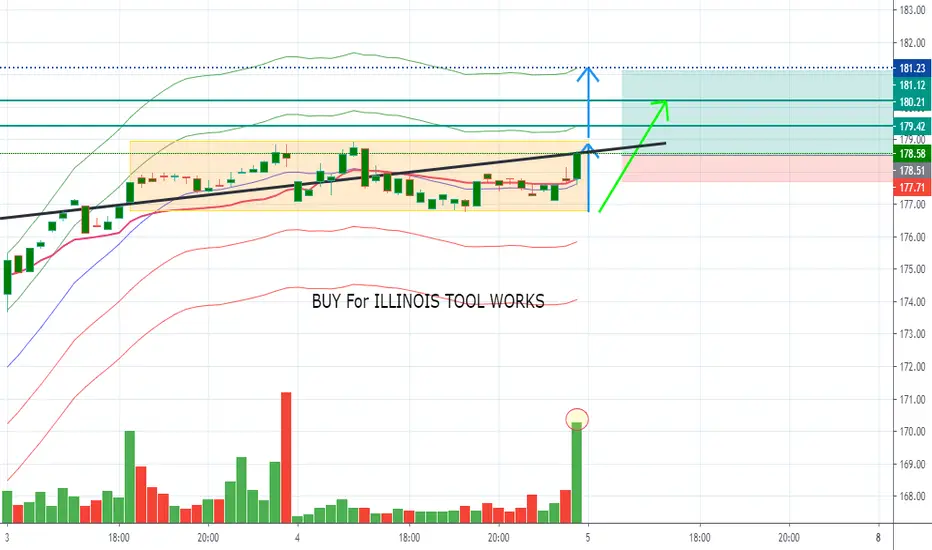
Potential breakout in Illinois Tool works====Entry level $161 - Target price $177====
Illinois Tool Works, Inc. manufactures industrial products and equipment. It operates through the following segments: Automotive OEM, Test & Measurement and Electronics, Food Equipment, Polymers & Fluids, Welding, Construction Products, and Specialty Products. The Automotive OEM segment produces components and fasteners for automotive-related applications. The Test & Measurement and Electronics segment manufactures equipment, consumables, and related software for testing and measuring of materials, structures, gases and fluids. The Food Equipment segment supplies commercial food equipment and provides related services. The Polymers & Fluids segment provides adhesives, sealants, lubrication and cutting fluids, janitorial and hygiene products, and fluids and polymers for auto aftermarket maintenance and appearance. The Welding segment furnishes arc welding equipment, consumables and accessories for a wide array of industrial and commercial applications. The Construction Products segment makes construction fastening systems and truss products. The Specialty Products segment manufacturing beverage packaging equipment and consumables, product coding and marking equipment and consumables, and appliance components and fasteners. The company was founded by Byron L. Smith in 1912 and is headquartered in Glenview, IL.

ITW Bull Put SpreadDaily Chart RSI <5
S/R at approx 145/144 Level. With multiple Price Action touch points previously
Also close to MA200
Looking for Reversal to mean higher.
Taking 145/144 Put Credit Spread.
Also picked up 146 Call for Directional Bias Higher.
Sept Exp .
Good Luck - Watch your $$$ RISK
