"Gold is money. Everything else is credit." --JP Morgan"Gold is money. Everything else is credit." --JP Morgan
Below the 4 year moving average
Below the Cloud
On brink of CRITICAL breakdown
J P Morgan Chase & Co Depositary Shares, each representing a 1/400th interest in a share of JPMorgan Chase & Co. 4.75% Non-Cumulative Preferred Stock, Series GG
No trades
JPM/PJ trade ideas

Banking on Strength: Trade of the WeekNYSE:JPM surges into focus with AI model grade: A and +8.81% upside potential by April 30. Strong Q1 results, resilient fundamentals, and predicted range up to $258.08 make this a compelling buy-the-dip candidate. Key support: $220.32 | Resistance: $258.08 NYSE:JPM

JPM Long PositionHi traders,
Let´s have a look at JPM on 1D chart timeframe. Currently the price remains below the donwsloping resistance line. We expect that the price will breakout the donwsloping resistance line in the near future.
We recommend to take a long position only if the successful breakout occurs, in order to avoid trading the fake out, look for the volume increase.
2 targets are shown in the chart!

Potential Downtrend in JPMorgan JPMorgan Chase has rallied sharply in recent sessions, but some traders may see downside risk.
The first pattern on today’s chart is the series of lower highs and lower lows since mid-February. JPM is returning near the top of that descending channel. Could another lower high result?
Second, JPM is potentially stalling at the March 31 low of $237.36. Old support may have become new resistance.
Third, prices are stalling around the 21-day exponential moving average.
Next, economic sentiment has recently deteriorated. Mortgage rates are higher, consumer credit growth has slowed, business surveys have missed estimates and confidence measures have weakened. JPM responded by hiking loan-loss reserves in its latest quarterly report. Continuation of those trends may drag on the megabank’s fundamentals.
Finally, JPM is a highly active underlier in the options market, trading about 125,000 contracts per session in the last month. (It ranks 18th in the S&P 500, according to TradeStation data.) That could help traders take positions with calls and puts.
TradeStation has, for decades, advanced the trading industry, providing access to stocks, options and futures. If you're born to trade, we could be for you. See our Overview for more.
Past performance, whether actual or indicated by historical tests of strategies, is no guarantee of future performance or success. There is a possibility that you may sustain a loss equal to or greater than your entire investment regardless of which asset class you trade (equities, options or futures); therefore, you should not invest or risk money that you cannot afford to lose. Online trading is not suitable for all investors. View the document titled Characteristics and Risks of Standardized Options at www.TradeStation.com . Before trading any asset class, customers must read the relevant risk disclosure statements on www.TradeStation.com . System access and trade placement and execution may be delayed or fail due to market volatility and volume, quote delays, system and software errors, Internet traffic, outages and other factors.
Securities and futures trading is offered to self-directed customers by TradeStation Securities, Inc., a broker-dealer registered with the Securities and Exchange Commission and a futures commission merchant licensed with the Commodity Futures Trading Commission). TradeStation Securities is a member of the Financial Industry Regulatory Authority, the National Futures Association, and a number of exchanges.
Options trading is not suitable for all investors. Your TradeStation Securities’ account application to trade options will be considered and approved or disapproved based on all relevant factors, including your trading experience. See www.TradeStation.com . Visit www.TradeStation.com for full details on the costs and fees associated with options.
Margin trading involves risks, and it is important that you fully understand those risks before trading on margin. The Margin Disclosure Statement outlines many of those risks, including that you can lose more funds than you deposit in your margin account; your brokerage firm can force the sale of securities in your account; your brokerage firm can sell your securities without contacting you; and you are not entitled to an extension of time on a margin call. Review the Margin Disclosure Statement at www.TradeStation.com .
TradeStation Securities, Inc. and TradeStation Technologies, Inc. are each wholly owned subsidiaries of TradeStation Group, Inc., both operating, and providing products and services, under the TradeStation brand and trademark. When applying for, or purchasing, accounts, subscriptions, products and services, it is important that you know which company you will be dealing with. Visit www.TradeStation.com for further important information explaining what this means.

JPM Technical Analysis: Earnings Catalyst & Deregulation Boost Context & Market Overview
I'm extremely bullish on JPMorgan Chase ( NYSE:JPM ) right now—lots of bullish catalysts are aligning:
- Major deregulation is underway:
- Consumer Financial Protection Bureau dismantled ✅
- Trump's regulatory pivot pre-earnings ✅
- FDIC Acting Chair set to push further deregulation ✅
- Potential Powell pivot (interest rates) in May/June? ❓
- Upgrades by Wells Fargo and Goldman Sachs ($280-$300 Price Targets)
Jimmy Dimon is getting superhero-like credit for possibly influencing policy decisions just by his appearance on Fox News! JPM feels like the "Nvidia of finance," positioned strongly amidst this policy pivot.
Weekly Chart
JPM is recovering with overhead resistance to monitor closely:
- Resistance Zones:
- Initial Resistance: $247.75 - $250.00
- Secondary Resistance: $264.00 (Best Price Short)
- Immediate Support Zones:
- Primary Support: $231.50 - $234.30
- Gap Fill Support: Around $228.00
Trading Scenarios
Bullish Scenario (strong deregulation + earnings optimism):
- Entry Trigger: Confirmed bounce and support around $231.50 - $234.30 or gap fill at $228.00.
- Profit Targets:
- Target 1: $247.75 (initial resistance)
- Target 2: $264.00 (next bullish target)
- Stop Loss:
- Below $227.00 to manage downside risk carefully.
Bearish Scenario (earnings miss or negative surprises):
- Entry Trigger: Breakdown and confirmed close below $227.00 (gap-fill level).
- Profit Targets:
- Target 1: $215.25 (previous support)
- Target 2: $199.00 (major support level)
- Stop Loss:
- Above $234.50 to protect against bullish recovery.
Personal Trade Idea
Thinking of using call options dated between April 25th to May 2nd to capture potential moves without overly tight expiry pressure—same-day/week options have been challenging for my portfolio. This looks compelling, especially if JPM’s deregulation tailwinds and earnings momentum play out.
Final Thoughts
The setup for JPM is highly appealing due to regulatory catalysts, earnings anticipation, and analyst optimism. Nonetheless, volatility remains high, so risk management is essential. This analysis is my personal view—posting to hold myself accountable!
📢 Disclaimer
This content is for informational and educational purposes only. It reflects my personal opinion and is not financial advice, a recommendation, or an endorsement to buy or sell any security. All investments carry risk, and you should do your own research or consult a licensed financial advisor before making any trading decisions. Options involve significant risk and may not be suitable for all investors.

JPMorgan Chase Reports Earnings Today, Topping Q1 EstimatesShares of JPMorgan Chase (NYSE: NYSE:JPM ) are currently up 3% in Friday's premarket session as the asset tops Q1 estimates.
The company reported better-than-expected fiscal first-quarter results as big banks kicked off the new earnings season.
The banking giant reported earnings per share (EPS) of $5.07 on revenue of $45.31 billion, each up from $4.44 and $41.93 billion, respectively, a year ago. According to estimates compiled by Visible Alpha, some analysts had expected $4.64 and $43.55 billion. It generated $23.4 billion in net interest income (NII), above the $23.00 billion consensus.
Shares of JPMorgan were up 3% immediately following the release of Friday's report. They entered the day down roughly 5% year-to-date but up about 16% in the last 12 months.
"The economy is facing considerable turbulence (including geopolitics), with the potential positives of tax reform and deregulation and the potential negatives of tariffs and 'trade wars,' ongoing sticky inflation, high fiscal deficits and still rather high asset prices and volatility," JPMorgan CEO Jamie Dimon said. "As always, we hope for the best but prepare the Firm for a wide range of scenarios."
Dimon wrote in his annual letter to shareholders this week that he expected the Trump administration's tariffs "will slow down growth."
technical Outlook
As of the time of writing, NYSE:JPM shares are already up 1.5% with the asset trading above the support point. A break above the 1-month high pivot could set the course for a bullish campaign eyeing the $260- $280 region.
With the last close RSI at 46, NYSE:JPM shares has more room to capitalize on the dip and make a comeback prior the earnings beat.

JPM - Resistance: 230; Support: 204NYSE:JPM moving under 200 day EMA. Strong resistance at 230 and support at 204

OptionsMastery: H&S on JPM! Sound on!🔉
📣Make sure to watch fullscreen!📣
Thank you as always for watching my videos. I hope that you learned something very educational! Please feel free to like, share, and comment on this post. Remember only risk what you are willing to lose. Trading is very risky but it can change your life!

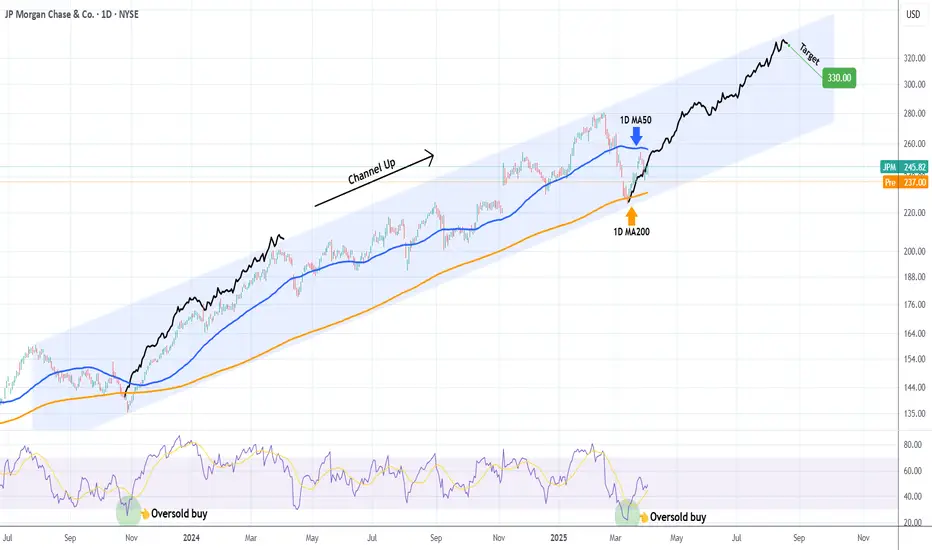
JP MORGAN won't give a better buy opportunity in 2025.Last time we looked at JP Morgan Chase (JPM) on November 27 2024 (see chart below), it gave us a clear sell signal that went straight to our $236 Target:
Now that the price rebounded not only on the 1D MA200 (orange trend-line) but also on the bottom (Higher Lows trend-line) of the long-term Channel Up, we are switching back to buying a we even got the first pull-back on the 1D MA50 (blue trend-line).
Given that the 1D RSI also rebounded from oversold (<30.00) territory like the October 27 2023 Low did, we expect a similar Bullish Leg to follow and thus our Target is $330 at the top of the Channel Up.
-------------------------------------------------------------------------------
** Please LIKE 👍, FOLLOW ✅, SHARE 🙌 and COMMENT ✍ if you enjoy this idea! Also share your ideas and charts in the comments section below! This is best way to keep it relevant, support us, keep the content here free and allow the idea to reach as many people as possible. **
-------------------------------------------------------------------------------
💸💸💸💸💸💸
👇 👇 👇 👇 👇 👇
JPMorgan at a Crossroads Bullish Surge or Bearish Retreat ? Hello, fellow traders!
Today, I’m diving into a detailed technical analysis of JPMorgan Chase & Co. (JPM) on the 2-hour chart, as shown in the screenshot. My goal is to break down the key elements of this chart in a professional yet accessible way, so whether you’re a seasoned trader or just starting out, you can follow along and understand the potential opportunities and risks in this setup. Let’s get started!
Price Action Overview
At the time of this analysis, JPM is trading at 243.62, down -1.64 (-0.67%) on the 2-hour timeframe. The chart spans from late March to early May, giving us a good look at the recent price behavior. The price has been in a strong uptrend, as evidenced by the higher highs and higher lows, but we’re now seeing signs of a potential pullback or consolidation.
The chart shows a breakout above a key resistance zone around the 234.50 level (highlighted in red on the Volume Profile), followed by a retest of this level as support. This is a classic bullish pattern: a breakout, a retest, and then a continuation higher. However, the recent price action suggests some hesitation, with a small bearish candle forming at the current price of 243.62. Let’s dig deeper into the tools and indicators to understand what’s happening.
Volume Profile Analysis
The Volume Profile on the right side of the chart is a powerful tool for identifying key price levels where significant trading activity has occurred. Here’s what it’s telling us:
Value Area High (VAH): 266.25
Point of Control (POC): 243.01
Value Area Low (VAL): 236.57
Profile Low: 224.25
The Point of Control (POC) at 243.01 is the price level with the highest traded volume in this range, acting as a magnet for price. Since the current price (243.62) is just above the POC, this level is likely providing some support. However, the fact that we’re so close to the POC suggests that the market is at a decision point—either we’ll see a bounce from this high-volume node, or a break below could lead to a deeper pullback toward the Value Area Low (VAL) at 236.57.
The Total Volume in VP Range is 62.798M shares, with an Average Volume per Bar of 174.44K. This indicates decent liquidity, but the Volume MA (21) at 165.709K is slightly below the average, suggesting that the recent price action hasn’t been accompanied by a significant spike in volume. This could mean that the current move lacks strong conviction, and we might see a consolidation phase before the next big move.
Trendlines and Key Levels
I’ve drawn two trendlines on the chart to highlight the structure of the price action:
Ascending Triangle Pattern: The chart shows an ascending triangle formation, with a flat resistance line around the 234.50 level (which was later broken) and an upward-sloping support trendline connecting the higher lows. Ascending triangles are typically bullish patterns, and the breakout above 234.50 confirmed this bias. After the breakout, the price retested the 234.50 level as support and continued higher, reaching a high of around 248.02.
Current Support Trendline: The upward-sloping trendline (drawn in white) is still intact, with the most recent low around 241.50 finding support on this line. This trendline is critical—if the price breaks below it, we could see a deeper correction toward the VAL at 236.57 or even the 234.50 support zone.
Key Price Levels to Watch
Based on the Volume Profile and price action, here are the key levels I’m watching:
Immediate Support: 243.01 (POC) and 241.50 (recent low on the trendline). A break below 241.50 could signal a short-term bearish move.
Next Support: 236.57 (VAL) and 234.50 (previous resistance turned support).
Resistance: 248.02 (recent high). A break above this level could target the Value Area High at 266.25, though that’s a longer-term target.
Deeper Support: If the price breaks below 234.50, the next significant level is 224.25 (Profile Low), which would indicate a major trend reversal.
Market Context and Timeframe
The chart covers 360 bars of data, starting from late March. This gives us a good sample size to analyze the trend. The 2-hour timeframe is ideal for swing traders or those looking to capture moves over a few days to a week. The broader trend remains bullish, but the recent price action suggests we might be entering a consolidation or pullback phase before the next leg higher.
Trading Strategy and Scenarios
Based on this analysis, here are the potential scenarios and how I’d approach trading JPM:
Bullish Scenario: If the price holds above the POC at 243.01 and the trendline support at 241.50, I’d look for a bounce toward the recent high of 248.02. A break above 248.02 could signal a continuation toward 266.25 (VAH). Entry could be on a strong bullish candle closing above 243.62, with a stop-loss below 241.50 to manage risk.
Bearish Scenario: If the price breaks below 241.50 and the POC at 243.01, I’d expect a pullback toward the VAL at 236.57 or the 234.50 support zone. A short position could be considered on a confirmed break below 241.50, with a stop-loss above 243.62 and a target at 236.57.
Consolidation Scenario: Given the lack of strong volume and the proximity to the POC, we might see the price consolidate between 241.50 and 248.02 for a while. In this case, I’d wait for a breakout or breakdown with strong volume to confirm the next move.
Risk Management
As always, risk management is key. The 2-hour timeframe can be volatile, so I recommend using a risk-reward ratio of at least 1:2. For example, if you’re going long at 243.62 with a stop-loss at 241.50 (a risk of 2.12 points), your target should be at least 248.02 (a reward of 4.40 points), giving you a 1:2 risk-reward ratio. Adjust your position size to risk no more than 1-2% of your account on this trade.
Final Thoughts
JPMorgan Chase & Co. (JPM) is showing a strong bullish trend on the 2-hour chart, with a confirmed breakout above the 234.50 resistance and a retest of this level as support. However, the recent price action near the POC at 243.01 and the lack of strong volume suggest that we might see a pullback or consolidation before the next move higher. The key levels to watch are 241.50 (trendline support), 243.01 (POC), and 248.02 (recent high).
For now, I’m leaning slightly bullish as long as the price holds above 241.50, but I’ll be ready to adjust my bias if we see a break below this level. Stay disciplined, manage your risk, and let the market show its hand before taking a position.
What are your thoughts on this setup? Let me know in the comments below, and happy trading!
This analysis is for educational purposes only and not financial advice. Always do your own research before making any trading decisions.

HS top formingOH OH HOT DOG
Where to?
around the 170s for a homerun of the move.
we need to break below the trendline for it to work to the 0.382 and retest the trendline (or not retest)
straight for the domino stoploss hunt
For it to work we need 1. ratecuts to not arrive (less loans, too expensive)
2.sp500 to keep nuking which is acting up from the same reason as reason number 1
$JMP - It is still early butNYSE:JPM Even JP Morgan Chase is showing a potential head and shoulders. It is still early but still...👀

Potential Bearish and Neutral ScenariosPotential Scenarios:
Bearish Scenario: If the stock breaks the neckline at $250.96. The downside target is generally calculated by measuring the distance from the head to the neckline, and projecting that distance downwards from the breakout point.
Neutral Scenario: The stock could consolidate around $250, fighting to break upward.

JP MORGAN: Perfect 1W MA50 rebound targeting $350. JP Morgan is neutral both on its 1D and 1W technical outlooks (RSI = 54.173, MACD = 7.520, ADX = 32.502), suggesting that it remains inside the best buy zone for the long term. As a matter of fact, having rebounded exactly on its 1W MA50, this is the best buy opportunity since October 23rd 2023, which was the last time it hit the 1W MA50. As shown, the long term pattern is a Channel Up and every contact with the 1W MA50 has coincided with a 1W RSI test of the S1 Zone. There is no better buy entry than the current level and we can safely aim for yet another +57.76% run (TP = $350.00).
## If you like our free content follow our profile to get more daily ideas. ##
## Comments and likes are greatly appreciated. ##

JP Morgan LongJPM is now net long the regression break.
This a fast moving pair and I am considering my optoins.

JPM: Steady Growth with a Catalyst for Strategic Gains
- Key Insights: JPMorgan Chase & Co's market activity underscores a period of
controlled growth influenced by strategic financial instruments like the JP
Morgan collar. This mechanism suggests a reduction in price volatility,
offering investors an anchor amidst fluctuating markets. The magnetic effect
of the collar helps moderate market rallies, securing a stable trajectory
for JPM's share movement.
- Price Targets: With a view toward a long position, here are the recommended
targets and stop levels for the next week:
- T1: $248.08 (2.67% above current)
- T2: $265.79 (10% above current)
- S1: $229.16 (5.16% below current)
- S2: $217.47 (10% below current)
- Recent Performance: JPM has demonstrated resilience through its strategic
market engagements, especially with the installation of the collar at the
5565 strike price. This has created a gravitational effect, mitigating
severe market moves and ensuring relatively stable growth patterns in the
midst of broader market flux.
- Expert Analysis: Market sentiment, echoed by experts, appreciates JPM's
ability to maintain equilibrium in market excitement. The structured
financial mechanisms that JPM employs act as a cautious yet optimistic
roadmap for investors seeking stable appreciation. With the exertion of
significant influence over financial indices, JPM's strategies are steering
economic monitoring towards more predictable growth forecasts.
- News Impact: While JPM maneuvers through the market, external factors like the
downgrading of Tesla's price targets illustrate broader market adjustments
to resolve risk perceptions and brand sentiments, which can subtly reflect
on JPM's positioning. Such shifts in market expectations among high-stake
companies further frame JPM's calculated approach to fostering enduring
investor confidence.

$JPM Navigating a Narrow ChannelJPM has 2 plots playing out, a rising wedge nested with a larger broadening wedge. We have negative divergence showing up on TSI & RSI showing that we might reach an early peak in current weekly cycle. Though price is above the a horizontal resistance, there is a higher probability that this is a false breakout.
A weekly swing high can be a signal for an entry with expectation we break below wedge support.

JPM rally ending soon?My overall thesis is we are in the very early stages of a multi-year decline ultimately with the S&P 500 below 3500. I have been wrong many times before so I will just take this thing in stages and see if it plays out. After this massive decline, we should be in for a great market rally of many decades. I am expecting the market to end its recent rally this week. The current rarely would be about a week in length depending when it began for individual stocks. The rally has done a few important things with its slow and prolonged upward movement, mainly prevents a wave 3 signal from occurring during the next decline.
My wave 3 indicator tends to signal wave 3s and 3 of 3s. See my scripts for the specifics of the indicator. If the market had a short wave 4 up and then a sharp or prolonged drop during wave 5, a new wave 3 signal would occur which violates the currently placed Minor wave 3 (yellow 3). Allowing separation from the current wave 3 signal enables wave 5 to drop quick or slow.
This chart applies select movement extensions based on wave 1's movement on the left and then another based on wave 3's movement on the right. I keep the values between 0%-100% on the chart for wave 2s and 4s retracements of the preceding wave's movement for reference even though the retracement values would be inverted.
Specifically for JPM, Minor wave 3 was longer than wave 1, which does not place a maximum length on wave 5. Assuming wave 4 ends on Thursday or Friday, Minor wave 5 could be a week or longer. In that time, at the very least it should drop below wave 3's bottom of 224.23. Using some basic movement extensions, it will likely go lower. The 5 wave lower pattern for this fifth wave is hypothetical, but a bottom could occur between 203 and 214. Once we bottom, we should see another rally over a few weeks. I will forecast what that could look like as Intermediate wave 1 nears its end.

JPM: Eyeing Potential Buying Opportunities Amid Market VolatilitKey Insights: With JPMorgan Chase trading at $232.44, investors should monitor the
$225 support level, approximately 3% below the current price, as a potential
buying opportunity given the current broader market volatility indicated by the
high VIX. While there are recession concerns with a projected 40% possibility
from JPM's economists, the absence of severe declines in key economic indicators
like unemployment and business profits provides a mixed economic outlook.
Responding strategically to challenges, JPM's revised code of conduct
underscores attempts to enhance its corporate image and manage client relations
amid market fluctuations.
- Price Targets: For the coming week, professional
traders suggest long positions with the following levels: Stop Level 2 (S2) at
$223, Stop Level 1 (S1) at $225, Target 1 (T1) at $238, and Target 2 (T2) at
$242.
- Recent Performance: JPMorgan Chase shows resilience despite broader
market weakness, marked by its positioning near the critical $225 support level.
The overall market sentiment remains cautious, as reflected in the 10% S&P 500
correction from all-time highs, indicating potential pressure on financial
stocks like JPM.- Expert Analysis: Experts note JPM's robust response strategies
amid a volatile market environment, albeit tempered by possible recession
implications. A mixed economic scenario, with stable employment yet underlying
market uncertainties, continues to shape investor sentiment toward financial
equities like JPM.- News Impact: Recent amendments to JPMorgan Chase's code of
conduct reflect a strategic move to mitigate reputational risks and align
corporate ethics, potentially influencing its market perception and client
engagement positively in a challenging market landscape. Investors should watch
for any further policy changes and their impact on market performance and
sentiment.
JPM VP price predictionJPM Price prediction based on Volume Profile. Be ready to short when it retraces to fill the gap. As it is financial sector is overvalued

What a level for JPM- can it bounce from here?I've been waiting for the financials to come in hard like this for a while. Will we have a recession or not is the headline question pushing the markets down. But in reality, before making new highs the markets always pullback. Until they dont, but that would be just one time. is it this time or not is not for me to decide. I just do what i was taught to do- buy pullbacks or short the rallies...

JPMWe are going to invest in JPM shares, aiming for a 12% gain before the end of April. Good luck to everyone!

$JPM Tradespoon - Long Entry $266.80Tradespoon model generated long signal for JPMorgan Chase & Co NYSE:JPM/PJ . Predicted range: $266.80–$277.94. Trend: -0.81%. NYSE:JPM/PJ
