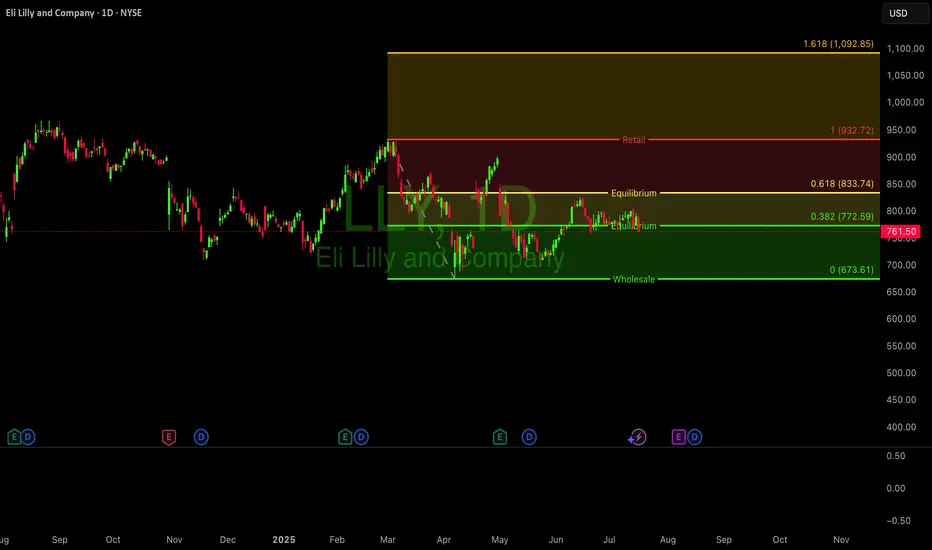
Just want to be there.. $LLYNYSE:LLY is showing classic signs of a Stage 3 top after its massive multi-year run. The trend has stalled, and the stock is now in a volatile sideways range.
Resistance: $975 Critical Support: $690
A weekly close below support would be a major bearish signal, potentially confirming the top and initiating a Stage 4 decline.
LLY trade ideas
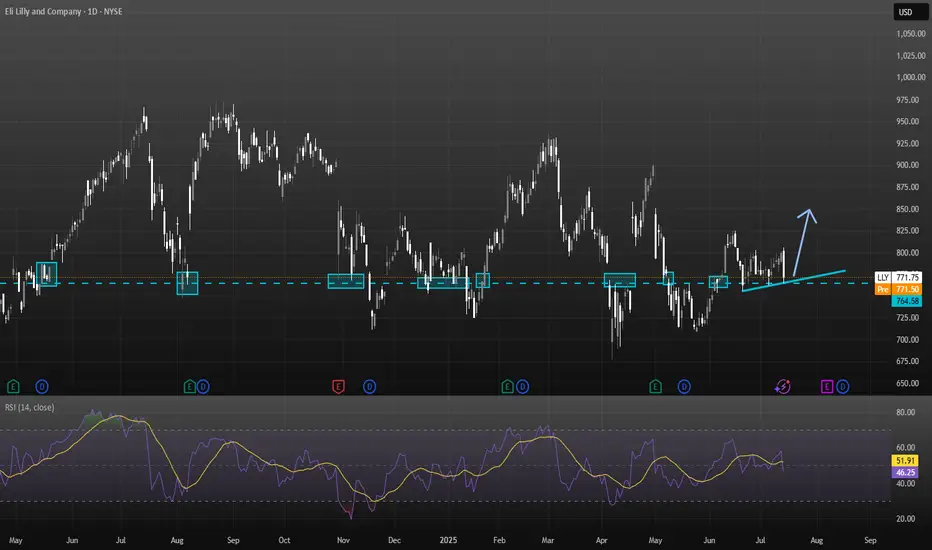
Eli Lilly (LLY) – Full Technical + Fundamental Analysis (July 20
I wanted to take a deeper dive into LLY and analyze more than just trendlines—looking into both the technical structure and the broader fundamentals of the stock.
Sources: i have a list of sources at the end of my report
Technical Breakdown:
Current Price: ~$771.75
Resistance Zone: $950–970 prior rejection levels
Support Zone:
Strong: $760–765 (multiple historical rejections and rebounds).
Secondary: $717 (previous bounce area).
Trendline: Steadily rising higher-lows, supporting price above $760.
RSI: Recently cooled from 79 (overbought) to ~51 (neutral), suggesting balanced conditions. No immediate overbought or oversold signals.
Chart Pattern Summary:
Price respects a higher-low ascending trendline.
Buyers defend $760, but $800+ remains heavy resistance.
Breakdown below $760 risks a drop to ~$717.
Breakout above $800 opens upside toward $950–970.
Growth Catalysts:
1. Zepbound & Mounjaro dominate the obesity/diabetes sector.
2. Retatrutide & Orforglipron (next-gen obesity treatments) could further expand market share by 2026.
3. Revenue growth: ~45% YoY in Q4 2024.
4. Analysts forecast ~15% annual revenue growth and 20%+ EPS CAGR through 2027.
Risks:
1. Q1 2025 saw adjusted EPS guidance trimmed to ~$20.78–22.28 from previous ~$22.50–24, causing ~7% drop in stock .
2. Valuation rich: forward P/E ~35 vs peers like Novo at ~14
3. 025 EPS estimates have slightly fallen (from $22.20 to $21.94) while 2026 expectations rose.
4. New rival Hengrui/Kailera shows ~18–19% weight loss, close to Zepbound’s ~21%, though still pre-approval
5. Regulatory volatility: Trump has floated heavy pharma tariffs (up to 200%) and repatriation incentives; Lilly has U.S. capacity but details remain uncertain
Analyst Sentiment:
Consensus target: $1,000+ within 12–24 months.
MarketBeat & StockAnalysis rate LLY as Strong Buy.
Institutional ownership remains high.
What to Monitor Next
1. FDA approvals for orforglipron or retatrutide (expected late 2025).
2. Next earnings—watch for forward guidance recovery.
3. Policy shifts (potential tariffs on pharma imports).
4. Obesity drug competition (Novo Nordisk, Chinese biosimilars).
Final Position: Modest Long Bias
Eli Lilly is technically holding trendline support while fundamentally leading in a booming therapeutic sector. Together, this makes LLY a long-term buy, though caution near $760 is warranted.
I tried to summaries as short as possible as i didn't want to make this post into an essay
Please note this is not financial advice
Sources Used for Analysis:
1. Eli Lilly Company Filings & Reports
2. Latest Earnings Reports (Q1 2025, prior Q4 2024)
3. Pipeline Updates and FDA Submission News
4. MarketBeat (Analyst ratings & price targets)
5. Yahoo Finance (EPS estimates, revenue growth forecasts)
6. StockAnalysis.com (Valuation ratios, dividend data)
7. Bloomberg and CNBC (News on guidance revisions)
8. Federal Reserve statements and forecasts
9. Bureau of Labor Statistics (BLS) – healthcare inflation data
10. WSJ and Financial Times – reporting on pharma tariffs and global healthcare policy shifts
11. Industry and Sector Insights
12. Novo Nordisk Investor Updates – competitor tracking
13. Statista – Obesity/diabetes global prevalence reports
14. World Health Organization (WHO) reports
15. Standard RSI and trendline patterns (based on TradingView style)
16. Support/resistance zones derived from historical price action Market Sentiment Tools
17. CNN Fear & Greed Index
18. S&P 500 Health Care Sector ETF (XLV) trends
LLY - Earnings upcoming, recent news makes this appealing📈 LLY — Eli Lilly & Co.
Ticker: LLY | Sector: Biotech / Pharmaceuticals
Date: July 26, 2025
Current Price: ~$813
Resistance Zone: $825
Support Zone: $740–$750
🧪 Recent Drug News
1. EMA Backs Alzheimer’s Drug Donanemab (Kisunla)
The European Medicines Agency’s advisory committee has issued a positive opinion on donanemab for early Alzheimer's patients with confirmed amyloid pathology and fewer ApoE4 gene copies. This reverses a previous rejection and paves the way for a likely EU approval in the coming months. Data from TRAILBLAZER‑ALZ trials showed slower cognitive decline and improved safety with a modified dosing regimen, while Europe’s Alzheimer’s patient population is projected to nearly double by 2050.
2. Orforglipron Shows Promising Phase 3 Results
Lilly’s investigational oral GLP‑1 therapy, orforglipron, achieved clinically significant results in Phase 3: A1C reductions of 1.3%–1.6% across doses, weight loss averaging 7.9% at the highest dose, and efficacy seen as early as four weeks. The safety profile was consistent with injectable GLP‑1 drugs, offering a powerful oral option for type 2 diabetes management.
⚡ Analyst & Market Recap (Past Week)
HSBC issued a double downgrade, lowering its rating to "Reduce" and cutting its price target from $1,150 to $700, citing valuation concerns and competitive pressure in the weight-loss space.
Erste Group downgraded LLY from “Buy” to “Hold,” slowing expectations around drug pipeline momentum.
Despite this, other analysts maintain a positive outlook, with the average 12-month price target in the $1,012–$1,016 range, spanning a wide band from $700 to $1,190.
Investor sentiment is shifting cautiously due to rising competition and high multiples.
🔍 Technical & Market Structure
Based on the latest 30-minute chart:
Price remains stuck within a sideways trading range, bounded by a resistance level near $825 and support in the $740–$750 area.
Momentum is building but hasn’t broken through significant technical thresholds yet.
✅ Bullish Scenario
Trigger: Break and hold above $825
Targets: $850 → $900 → $950
Catalysts: Oral GLP‑1 approval prospects, Alzheimers regulatory momentum, and possible drug trial successes
❌ Bearish Scenario
Trigger: Breakdown below $740
Targets: $700 → $670
Risks Include: Rising competition from Novo Nordisk, slowing pipeline news, valuation compression, and analyst downgrades
🧠 Strategic Summary
LLY is operating in a tight technical corridor, with the potential for volatility driven by both clinical and regulatory catalysts. The recent drug developments—donanemab's EMA advancement and orforglipron's strong Phase 3 results—may supply fuel for a bullish breakout if momentum shifts convincingly above $825. Conversely, bearish pressure may intensify if the downside at $740 breaks.
Key levels to watch: breakout above $825 or failure below $740.
Long Healthcare and BiotechI think we will go for all time highs soon
TP 1 over 900
Got 2 stop losses on chart depending on time horizon and risk apatite
$LLY Technical Setup – Breakout ReloadingNYSE:LLY is holding a critical mid-range level, and the chart hints at a potential accumulation before a breakout. Here's the updated view:
🔹 Horizontal Range Still Intact: Price remains trapped between ~$710 support and ~$965 resistance. These levels have acted as major turning points for over a year — creating a defined trading range.
🔹 False Breakdown & Quick Recovery: After dipping below support, price quickly reclaimed the $795 level — often a signal of seller exhaustion and demand stepping in. This creates a potential bear trap scenario.
🔹 Rejection Zones Marked: Prior attempts to break above ~$965 have failed at the same zone (highlighted in blue), forming a strong but vulnerable ceiling. Each attempt weakens the resistance.
🔹 Current Structure Suggests Stair-Step Higher:
Holding $795 could attract more buyers.
A higher low formation would build pressure for a push toward the top of the range.
Break and hold above $965 opens the door to ATH continuation.
🔹 Trade View:
Entry: ~$790–$800 zone
Stop: Below $709 (red zone — invalidation level)
Target: $965, possibly higher if breakout confirms
💡 Why Price Could Rise:
Price just reclaimed a key level that previously acted as a major pivot.
Strong pharma sector sentiment and NYSE:LLY 's leadership in the GLP-1 space remain intact.
Technical structure supports continuation of the larger range cycle.
🚫 Not financial advice — just charting the probabilities. Watch for confirmation!

$LLY Low Risk - CookieLow Risk opportunity on NYSE:LLY it is right at the wholesale level... good holding area.. Have a beautiful day!

ELI LILLY Is starting its next big rally.Eli Lilly (LLY) is about to test its 1W MA50 (blue trend-line) following a rebound just below the 1W MA100 (green trend-line). The latter, has been the ultimate market Support since May 2018 (last time it broke below it).
The overall correction since the July 15 2024 High seems like a Bull Flag pattern, no different than all the others after 2018 which only served as healthy rebalancing of an overbought price action.
Based on he 1W RSI in particular and the Bullish Divergence it displayed, the current Bull Flag resembles more the March - October 2019 pattern. Both that and the next one reached their 2.0 Fibonacci extensions.
As a result, our long-term Target on LLY is just below the 2.0 Fib at $1300.
-------------------------------------------------------------------------------
** Please LIKE 👍, FOLLOW ✅, SHARE 🙌 and COMMENT ✍ if you enjoy this idea! Also share your ideas and charts in the comments section below! This is best way to keep it relevant, support us, keep the content here free and allow the idea to reach as many people as possible. **
-------------------------------------------------------------------------------
💸💸💸💸💸💸
👇 👇 👇 👇 👇 👇

Eli Lillly $LLYNYSE:LLY – Long Setup Ahead of June FOMC
Eli Lilly remains fundamentally strong, with robust growth in revenue (+45% YoY), driven by weight-loss and diabetes drugs like Mounjaro and Zepbound. Despite this, the stock saw a recent pullback after a lowered FY25 profit outlook.
Technical View:
LLY is trading near a key support zone around $710. The setup offers a favorable 1:5 risk/reward ratio, with a stop at $700.86 and a target near $768. Bollinger Bands are tightening, indicating a potential breakout.
This decline could be partially driven by market caution ahead of the upcoming FOMC meeting in June. If support holds, we may see a bounce toward the $760–770 area.
Plan:
Entry: ~$710
Target: ~$768
Stop: ~$700.86
Risk/Reward: 1:5
Watching price action closely near the lower Bollinger band.

LLY Daily: Navigating Key Levels - Two Strategic OpportunitiesOVERVIEW:
LLY has recently undergone a significant correction from its highs, finding strong demand at a crucial support zone. Price action now presents two distinct, high-probability long entry scenarios based on the stock's interaction with key horizontal levels. My analysis outlines potential entry points, clear targets, and risk management.
KEY OBSERVATIONS & MARKET STRUCTURE:
Major Demand Zone Established:
Following a notable pullback in early May, LLY found substantial buying interest within the lower green horizontal zone (approximately $680 - $710). This area has acted as a robust "Support Trade" zone, preventing further downside and initiating a corrective bounce.
Corrective Rally & Intermediate Resistance:
From this strong support, LLY mounted a decent rally, completing a clear W-formation or basing pattern (highlighted by the orange and blue zig-zag lines).
Price is currently interacting with an intermediate resistance level / supply zone (the upper grey/light green horizontal zone around $755 - $775). This level represents a critical point of contention between buyers and sellers.
Two Strategic Entry Scenarios:
The current market context offers two distinct long entry approaches, each with its own risk/reward profile:
Scenario 1: Breakout Trade (Orange Ellipse / "1st Entry Above 775")
A. Condition: This strategy focuses on a decisive breakout and sustained close above the current intermediate resistance level (approx. $775). A strong daily candle closing above this zone would confirm bullish momentum.
B. Entry: Look for price action to confirm the breakout, potentially on a retest of the broken resistance now acting as support (as indicated by the orange arrow and ellipse). An entry above $775 is targeted here.
C. Risk Management: A stop-loss should be placed just below the breakout level and the recent swing low, ideally around $745.33 (bottom of the red box).
Scenario 2: Support Trade (Blue Ellipse / "2nd Entry 710")
A. Condition: This strategy anticipates a potential rejection from the current intermediate resistance, leading to a pullback to the primary demand zone (approx. $710).
B. Entry: Look for strong bullish reversal signals (e.g., bullish engulfing candle, hammer, demand zone rejection) if price retraces to the lower demand zone around $710 (indicated by the blue arrow and ellipse). This offers a potentially lower risk entry with a better risk-to-reward ratio for the same targets.
C. Risk Management: A stop-loss would be positioned just below the main support zone, around $675.70 (bottom of the larger red box).
POTENTIAL TARGETS:
Regardless of the entry scenario, our upside targets remain consistent based on prior price structure and supply zones:
• 1st Target: $860 (Green Zone): This is a significant resistance level from earlier price action, representing the first major hurdle for buyers.
• 2nd Target: $920 (Upper Green Zone): This represents the ultimate upside target, aligning with the previous all-time highs and a major supply zone.
INVALIDATION:
• For "Breakout Trade" (1st Entry): A sustained daily close below $745.33 would invalidate this specific trade idea.
• For "Support Trade" (2nd Entry): A sustained daily close below $675.70 would invalidate the entire bullish bias derived from the primary demand zone and suggest further downside is likely.
CONCLUSION:
LLY is presenting clear technical setups after finding substantial support. Traders can opt for an aggressive Breakout Trade if momentum sustains through intermediate resistance, or a more conservative Support Trade if price retraces to the established demand zone. Both strategies aim for significant upside potential towards $860 and $920, with clearly defined risk management levels.
Risk Management is Paramount : Always adhere to your stop-loss and position sizing to protect your capital. This is not financial advice; do your own research.
Disclaimer:
The information provided in this chart is for educational and informational purposes only and should not be considered as investment advice. Trading and investing involve substantial risk and are not suitable for every investor. You should carefully consider your financial situation and consult with a financial advisor before making any investment decisions. The creator of this chart does not guarantee any specific outcome or profit and is not responsible for any losses incurred as a result of using this information. Past performance is not indicative of future results. Use this information at your own risk. This chart has been created for my own improvement in Trading and Investment Analysis. Please do your own analysis before any investments.


LLY is now interested?Interested Chart??
Eli Lilly (LLY) is one of the Big Pharma stocks with strong fundamentals, and it's a growth stock too. So, is it a good time to accumulate now??
After LLY's price kept dropping for a while, it now seems to be forming a structure where it's not falling below $700. Looks like it might be building a base.
Let's discuss this together!
Non-financial advice
#US #Stock

LLY: Potential Bounce Play with 20–30% UpsideLooking for a stock that had strong momentum before but has slowed down over the past year? One that’s now trading near the bottom of its consolidation range, with about a 30% drop from recent highs? LLY fits that description pretty well.
Based on its pattern, it looks like there’s a good chance it could bounce back toward $970, offering 20–30% upside in the next six months.

ELI LILLY - Still more downwards potentialAn interesting company , and their weiht loss pill is very interesting, but for now I´m more on the short side

Eli Lilly Stock Down 10.9% Over Past YearTop or Consolidation? Here's My Take...
It's not crystal clear — I can see the case for both. But after years of chart-watching, this doesn't quite look like a top to me:
• Lacks symmetry
• Had chances to break down, but no real follow-through
🧭 Where are we headed?
I think pressure remains, and we could dip toward the 50% retracement of the 2023 move — that’s around 646.
🔁 If we bounce from there, I’ll shift my bias to a recovery and resumption of the long-term uptrend.
Disclaimer:
The information posted on Trading View is for informative purposes and is not intended to constitute advice in any form, including but not limited to investment, accounting, tax, legal or regulatory advice. The information therefore has no regard to the specific investment objectives, financial situation or particular needs of any specific recipient. Opinions expressed are our current opinions as of the date appearing on Trading View only. All illustrations, forecasts or hypothetical data are for illustrative purposes only. The Society of Technical Analysts Ltd does not make representation that the information provided is appropriate for use in all jurisdictions or by all Investors or other potential Investors. Parties are therefore responsible for compliance with applicable local laws and regulations. The Society of Technical Analysts will not be held liable for any loss or damage resulting directly or indirectly from the use of any information on this site.

LLY bullish flag
1. Bullish flag on weekly
2. FVG serving as possible support on weekly
3. On daily there is also a strong support nearby

LLY - Stock held $720 support next level at $760LLY - Stock back to bouncing off $720 support level on the weekly time frame. Needs to break and hold $760 resistance level for a move towards $800 . Eli Lilly's Zepbound Shows Superior Weight Loss Over Novo Nordisk's Wegovy In Head-To-Head Trial. calls above $760 look good for a move towards $800.

LLY Eli Lilly - Buy Cycle MidtermLLY
Buy Cycle
Midterm
TP@843.7
% Bubble Ratio
Currently in a negative bubble with midterm buying cycle and fair value at 843.7 (tp)
Spot trading plan:
Start buying at -30% bubble ratio (590) and below
Entry 1: -30%
Entry 2: -40%
Entry 3: -50%
Exit: 843.7 (TP)

Can Lilly Redefine Weight Loss Market Leadership?Eli Lilly is rapidly emerging as a dominant force in the burgeoning weight loss drug market, presenting a significant challenge to incumbent leader Novo Nordisk. Lilly has demonstrated remarkable commercial success despite its key therapy, Zepbound (tirzepatide), entering the market well after Novo Nordisk's Wegovy (semaglutide). Zepbound's substantial revenue in 2024 underscores its rapid adoption and strong competitive standing, leading market analysts to project Eli Lilly's obesity drug sales will surpass Novo Nordisk's within the next few years. This swift ascent highlights the impact of a highly effective product in a market with immense unmet demand.
The success of Eli Lilly's tirzepatide, the active ingredient in both Zepbound and the diabetes treatment Mounjaro, stems from its dual mechanism targeting GLP-1 and GIP receptors, offering potentially enhanced clinical benefits. The company's market position was further solidified by a recent U.S. federal court ruling that upheld the FDA's decision to remove tirzepatide from the drug shortage list. This legal victory effectively halts compounding pharmacies from producing unauthorized, cheaper versions of Zepbound and Mounjaro, thereby protecting Lilly's market exclusivity and ensuring the integrity of the supply chain for the approved product.
Looking ahead, Eli Lilly's pipeline includes the promising oral GLP-1 receptor agonist, orforglipron. Positive Phase 3 trial results indicate its potential as a convenient, non-injectable alternative with comparable efficacy to existing therapies. As a small molecule, orforglipron offers potential advantages in manufacturing scalability and cost, which could significantly expand access globally if approved. Eli Lilly is actively increasing its manufacturing capacity to meet anticipated demand for its incretin therapies, positioning itself to capitalize on the vast and growing global market for weight management solutions.

Eli Lilly (LLY) Shares Fall Over 15% in MayEli Lilly (LLY) Shares Fall Over 15% in May
The share price of Eli Lilly and Company (LLY), the world’s largest pharmaceutical company, has seen a sharp shift in market sentiment:
→ From its April low to high, LLY shares rose by over 30%;
→ However, since the start of May, the LLY stock price has dropped more than
15% — the closing price on the last trading day of April was around $895, while today the share is trading near $775.
Why Are Eli Lilly (LLY) Shares Falling?
The decline can be attributed to three key factors:
1→ Q1 Earnings Report: Although the company reported earnings per share above expectations ($3.34 vs $3.25), investors may have been concerned by significantly higher spending on research and development.
2→ Competitor Partnership: CVS Health’s announcement that it will offer Novo Nordisk’s Wegovy instead of Lilly’s Zepbound added further pressure to LLY shares.
3→ Sector Sentiment: Broader biotech sentiment turned negative following reports that the Trump administration is considering a pricing model that would cap drug prices based on lower rates in other countries.
The media is also discussing upcoming decisions from Vinay Prasad, the new head of the FDA division overseeing vaccines and gene therapy.
Technical Analysis: Eli Lilly (LLY) Share Chart
Key price movements (marked on the chart) justify the formation of a downward channel.
On the one hand, bearish sentiment may intensify in light of recent developments. The median line of the channel could act as resistance to any upward movement.
On the other hand, bulls may find support around the $765 level — a former resistance point and the boundary between two price gaps.
This article represents the opinion of the Companies operating under the FXOpen brand only. It is not to be construed as an offer, solicitation, or recommendation with respect to products and services provided by the Companies operating under the FXOpen brand, nor is it to be considered financial advice.

LLY watch $833 then 800 round: Dips to buy for next leg upLLY announced new weight loss drug in pill form.
News created a spike which might retrace some.
$833.38 is high support, 800 well supported by fibs.

LLY bullish reversal confirmed.. BUY BUY BUYLLY bully reversal is absolutely confirmed
We have the following confirmations
1) closed above 20 day EMA
2) closed above 50 day EMA
3) closed above 200 day EMA
4) RSI above 60
wait till another candle closes above 200 day EMA
Buy at 866
Stop loss @ 790
TP @ 964

LLY LONG D/WLLY is in an uptrend and this is the weekly trend line. It is likely to make a low and move up to fill the gap. My good friend, I would be happy if you would follow me and leave me a comment.

LLY possible buy trend This chart highlights a recent price breakout followed by a pullback into consolidation.
Key indicators in play:
✅ EMA 9/20/56: Price is currently trading below all EMAs, showing fading momentum. The EMAs are curling down, suggesting short-term weakness or cooling after a strong move.
🟣 SMA 50 & 200: Price is sitting below both the 50-SMA and 200-SMA, indicating a bearish or neutral mid- to long-term setup. The flattening 200-SMA may act as a long-term base.
📉 VWAP (not shown but implied): Price is likely trading below VWAP, reinforcing the intraday bearish bias and low-volume consolidation.
📐 Support & Resistance Levels: Blue horizontal lines mark recent support/resistance flips, providing key zones to watch for a breakout or breakdown.
🧠 Outlook:
Current price action suggests a cool-down after a vertical run-up, with EMAs potentially acting as short-term resistance. Watching for a bounce off horizontal support or a move above the EMAs to confirm trend continuation.
