LMND: Catching the dip!LMND
.
Catching the dip!
✨✨✨
In fact, good entry points are usually either boring or when the crowd is fearful — not when everyone is excited and FOMO-ing.
🌺🌺🌺
US STOCKS- WALL STREET DREAM- LET'S THE MARKET SPEAK!
LMND trade ideas
LMND Long Trade Setup – Breakout Alert!🚨 🚨
Lemonade Inc. (LMND) has just broken above a key descending trendline on the 30-minute chart — signaling potential bullish momentum ahead. After days of consolidation, buyers stepped in right at the lower support zone, confirming a strong base.
📌 Trade Details:
🔹 Entry: $42.99 (above resistance)
🔹 Stop Loss: $42.06 (below recent support)
🔹 Target: $44.38 (previous supply zone)
🔹 Risk/Reward: Solid R:R setup with breakout confirmation ✅
This setup aligns with a clean technical breakout — I’ll be watching for volume surge and price to hold above $43.
💡 Always manage risk and follow your trading plan!
—
📊 Shared by: ProfittoPath
#LMND #BreakoutTrade #StockSetup #TechnicalAnalysis #TradingView #ProfittoPath #SwingTrade #BullishSetup #StockMarket

Lemonade, Inc. (LMND) – AI-Driven Disruption in InsuranceCompany Snapshot:
Lemonade NYSE:LMND is a tech-forward insurer reinventing traditional insurance through AI, data science, and a mobile-first experience across renters, homeowners, auto, pet, and life products.
Key Catalysts:
AI + OpenAI Integration 🚀
Collaborations with OpenAI are powering Lemonade’s RealTime API and AI voice agents, improving claims automation and customer support.
Enhances scalability and reduces overhead, key to long-term margin expansion.
Operational Resilience 🔥
Despite a $22M wildfire loss in California, Lemonade met Q1 guidance—thanks to robust reinsurance and effective risk management, underscoring operational maturity.
Auto Insurance Momentum 🚗
Car insurance was the top growth driver in Q1 2025, tapping into a multi-billion-dollar market where Lemonade still holds early-stage penetration.
AI-powered underwriting gives it an edge over legacy incumbents.
Investment Outlook:
Bullish Entry Zone: Above $38.00–$39.00
Upside Target: $65.00–$70.00, supported by AI innovation, product diversification, and scalable infrastructure.
🧠 Lemonade is not just selling insurance—it’s rewriting the rulebook on how it’s delivered, priced, and experienced.
#Lemonade #LMND #Insurtech #AIInsurance #OpenAI #DigitalTransformation #AutoInsurance #TechStocks #GrowthStocks #ClaimsAutomation #Reinsurance #Fintech #CustomerExperience

LMND Wedge Breakout – Ready to Squeeze! 🚀
📝 Description:
LMND just broke out of a falling wedge while respecting its ascending trendline support. This is a classic bullish continuation pattern, backed by a healthy pullback and strong recovery from the $44 zone.
📍 Entry: $44.93
🎯 Target: $49.38
🛑 Stop Loss: $43.55
⚖️ R:R: Over 2:1
⏱️ Timeframe: 30-minute chart
🧠 Setup Style: Breakout + Trendline bounce
Watching for a clean move above $46.00 to confirm momentum. Looks like bulls are stepping in again after consolidation.
#LMND #BreakoutSetup #WedgePattern #TradingViewCharts #TechnicalAnalysis #ProfittoPath #SwingTrade

Lemonade Inc.: Breakout in Motion — Cup, Flag, and No BrakesLemonade Inc. (LMND) is accelerating after a clean breakout from a textbook cup with handle pattern, where the handle formed as a tight bullish flag. The breakout occurred around $32, and since then, price action has been sharp, controlled, and uncorrected — currently trading at $42.42 with buyers clearly in charge.
On the fundamental side, LMND is moving through a recovery phase: operational losses are narrowing, revenue is stabilizing, and the company is aggressively leveraging AI to automate its insurance processes. Expansion into Europe continues, and institutional interest is visibly rising — confirmed by volume building alongside price. Within the insuretech sector, LMND is starting to look like a comeback story rather than a cautionary tale.
Technically, the setup remains strong:
– Golden Cross confirmed (EMA50 crossing EMA200)
– EMA50/100/200 all below price — bullish structure firmly intact
– Volume expanding on up-days — healthy confirmation
– RSI hovering in the 60–65 range — momentum is intact, no signs of exhaustion
Targets remain aligned with the structure:
– tp1 = $64 — measured move from the flag
– tp2 = $94 — full realization of the cup pattern
Tactically, this is no longer a “wait and see” setup — the move is in progress. No correction so far, only continuation. Momentum traders may consider entries into strength. Above $45, the move could accelerate further as more participants recognize the structure.
LMND is showing technical and fundamental alignment — confirmed breakout, improving narrative, and strong trend structure. While the impulse holds, this chart favors continuation, not hesitation.

Lemonade Call Setup: Eyes on $46! 🍋📈"
📝 Caption/Description:
📈 Call Trade on LMND (30-min Chart)
🔹 Entry: $42.43
🔹 Stop Loss: $41.35
🔹 Target: $45.40 to $46.00
🔹 R:R Ratio: ~1:2.5
🔸 Breakout from bull flag + retest
🔸 Holding above trendline support
💡 Watch resistance at $43.75 for momentum continuation
🦅 Chart by ProfittoPath

Stock of the Week ! LMND Price Action June 2025Overview
Name: Lemonade, Inc.
Ticker Symbol: LMND
Exchange: New York Stock Exchange (NYSE)
Founded: 2015
Headquarters: New York City, USA
CEO: Daniel Schreiber (as of 2025)
Sector: Financial Services
About
Lemonade is a technology-driven insurance company that uses artificial intelligence (AI) and behavioral economics to disrupt traditional insurance. It offers a variety of insurance products through a mobile-first, digital platform:
Renters insurance
Homeowners insurance
Pet insurance
Term life insurance
Car insurance
Fundamentals
Overview
Statements
Earnings
Revenue
Key Takeways
Lemonade had a robust quarter with growth accelerating to 27% year-on-year to $151 million in Q1 2025., the 6th quarter of year-over-year (YOY) acceleration, and outperforming. The company posted losses this quarter that was less than expected.
Technicals
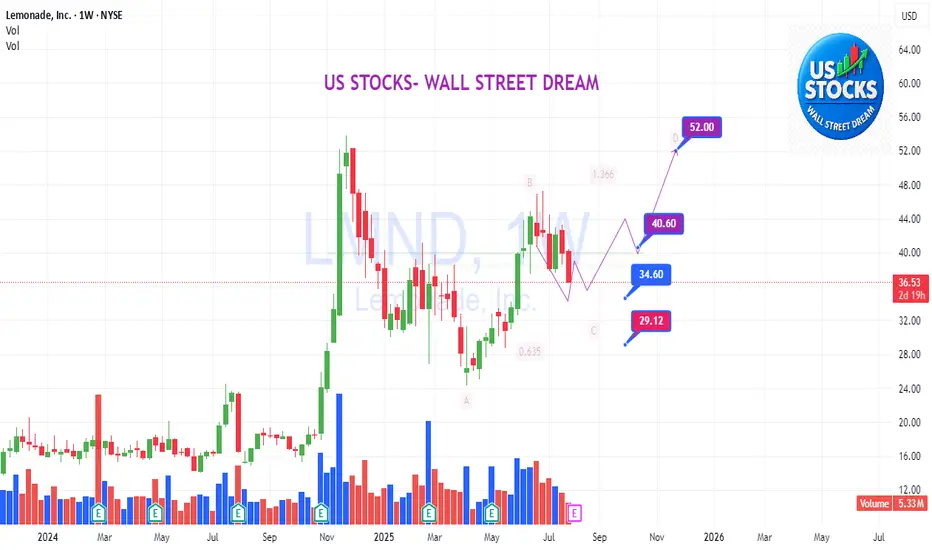
Price has crossed above the 50-week EMA (~$30) and is now at $38.98, suggesting strong bullish momentum. The 50-day MA also just crossed the 200 day MA forming a golden cross.
It also recently broke out of a falling wedge pattern formation on the 4hr timeframe.
It has formed and broken out a saucer suggesting a price reversal from 2021 on the weekly chart suggesting bullish momentum.
My Take
NYSE:LMND is showing a clear bullish momentum though it has entered overbought RSI signaling a consolidation or pullback near $42-$45 range. I am looking for a potential upside to
$52 by the end of the month.
Position: LMND 40 Call June 20 2025
Quantitly: 10
Average Cost Basis: 1.26
Last Price: 2.33
Total % Gain/Loss: +85%

Follow Up To Lemonade VideoHi, all. Just posting the chart idea outside of my video as well. This way you can press that "play" button and track how my trade idea is doing in real time. I've always really liked this feature.
If you want more of the thesis behind why I like NYSE:LMND , please feel free to scroll through the video that I just recorded.
Here's to further strong price action!
Reagen

Lemonade, Inc. Showing Momentum - Lets Make Lemonade!Hey, everyone. Wanted to get a video out since it has been awhile. Sorry about the rustling in the audio - bear with me as it is not a theme throughout.
I am pretty excited about the momentum that NYSE:LMND is showing. I've been in it with a position for a little bit lately, and was fortunate to catch the previous pump with profit, but I think the momentum has a strong chance to continue here.
I pretty much cover all my thoughts behind the idea in the video, so feel free to scroll through it at your own rate. I will post it as a chart idea as well so that you can hit the play button and track how the idea is actively performing.
Hope you all were able to whether the tariff tantrum and hoping the market can maintain its current positioning, or, better yet, show continued strength.
Enjoy,
Reagen

Lemonade may be ready for a squeezeNYSE:LMND broke dramatically into overbought territory on the weekly chart earlier this year. It's taken understandable time to digest those gains and now looks like it could be building steam to revisit prices reached during that breakout.
The shorter term 4H chart, more suitable for entry and exit signals, illustrates a recent break above a cup and handle formation. That little pump appears to be consolidating rapidly.
Should the shorter term move find traction, the the weekly chart could provide a reasonable target as a trading range is formed for a larger move in the long run. A swing trade looks attractive at this point with potential 50% upside.

$LMMD - Boom!If you like this analysis and want access to my indicators, consider following and supporting me.
Entry in the stock at 38.87. Initial stop at 31.50.
There has been a considerable increase in demand, represented by high volume starting from 02/26/2025. The first demand movement was to prevent the continuation of the price decline. The second movement occurs the following day with the breakouts of the Daily Heiken Ashi, the 1-month Exponential Moving Average, and, later, today, the downtrend line with peaks on 11/25/2024 and 02/18/2025.
x.com
One objection to this entry is that I prefer entries respecting breakouts of the 1-month, 3-month, and 1-year Donchian Channels, which is not the case yet for all of them. I maintained the entry due to the volume and demand in this current price range.
What do you think?

$LMND lagger in fintech, upside potential, EMA SMA crossingNYSE:LMND I'm a fan of financials, NYSE:MA , NYSE:V , NYSE:DFS , NASDAQ:PYPL , NASDAQ:AFRM , etc, even look at $SEZL. I think this name is a laggard in the sector and actually provides a good idea of business, something oversaturated but a different approach and ideas. With momentum and volume this name can trigger great upside potential in the next 3-6 months. Earnings are there and I look the setup here inside the triangle/flag. Long.
Also the 200ema and 200sma are riding nicely and the 50ema and 50sma are crossing over one another.
WSL

$LMND is about to SQUEEZE!When RonnieV gives you 🍋 make NYSE:LMND
🎯$65🎯$80 Inbound
Longer the base, higher the space!
- Looking for a flip to Green on the H5 and the Wr% to bottom out and start heading north before I would consider entering this trade
- RSI & STOCH are up trending
Not financial advice

$LMND Lemonade getting Fizzy Wedge/ Channel break
Breakout level back tested
Little IH&S on 30min
Support/reversal LOI $34.50 =
Upside Triggers
-PPWX $35.17
-$PPWX $35.74
PPDX $36.12
0.382 fib/ OCYX $36.68

Still uptrend on weekly chartStock is going down on low volume for the week. Likely will rise next week. Good R/R at the moment for shares or swing debit on upside.

Cash Flow Profitable When? End of 2027?Not sure I was taking a cue from ChatGPT and was hallucinating when I heard at investor day that LMND is targeting end of 2027 OR IN IRL ALMOST 3 YEARS FROM NOW to be cash flow positive....and yet the stock doubles. Yes Toto we're not in Kansas anymore....but in a weird wacky world where some diminutive being is pulling levers and making this stock go nuclear.
Have we seen this movie before? Yes we have and it doesnt end well.
Short term and I mean days not weeks I expect a pull back strictly on technicals. Stochastic RSI has been floating higher than helium and what floats high must come down eventually.
Shorting this one with a target of low 40s in the next 2 weeks. Good luck to all.

LEMONADE: $18.50 Time to Warehouse or BUY when everyone is GONEthis was very well covered and hyped INSURANCE issue which every promotor
peddle it as Warren Buffet hedge to the new era of Generative Insurance Ai
story was great
the packaging and business model was awesome
the payouts are instant and geared to impatient short attention spanned generation
the price tanks as early investors series abcs cashed out as generational wealth
this time for the last 18months is opportunity in time for FED cut rate
and Ai season

$LMND - What would I do?NYSE:LMND Lemonade has been basing in stage 1 - the bottom, for the past two years. It is currently at a major resistance that has been hard to break in the past.
Once it breaks through the resistance around $25, it will mark the beginning of stage 2 - the uptrend. Beware of false breakouts, though.
It is currently beginning to enter overbought territory, so I would caution against chasing the stock.
If I have a position, I would take some profit, just in case there is a hard rejection and a pullback from the resistance.
If I don't have a position, I would wait for either a breakout and subsequent retest of the major resistance to take a position, OR in case of a rejection, wait for it to come close to the support region/POC area.
The support, resistance, and targets are shown in the chart.
I have no position. Just helping someone.
As always, I share my opinions and trades. I'm not suggesting that anyone follow my trades. You do you.

LMND: A visit to the Dark SideLMND used to be the belle of the ball back during the pandemic days. Now its just struggling to gain some momentum.
Over the past 2 weeks leading up to earnings on July 30th, LMND has had a nice run. Unfortunately gravity will pull this stock back to earth very shortly UNLESS earnings are so stellar that it finally breaks out of the horizontal channel that has entombed this stock for the better part of over a year.
Stochastic RSI has been pegged on the high side for a long time historically and I have to believe that this is either due to short sellers closing positions or bulls trying to build some pre earnings momentum....or both is happening because earnings are stellar.
I believe the insurance market is very competitive and despite the use of AI LMND has still not hit its stride, so while earnings might be decent, I don't think it warrants additional upside.
Taking a short position....looking for a retreat to fill a long exposed gap with a price target of $14.

LMND will return to $180 in the next 6 months.Retraced: 1.1 From High
From Current Price to All time High: 940%
Consolidation for: 868 Days
Notes:
Macro trends look good, for this to easy reach $50, and with equity melting up by EOY, this could reach for the ATH again, before the bust.

In case you want to short somethingHS confirmed and price is testing the broken neck. Be careful, this one is very volatile. I have some puts expire by the end of the month, probably I should have given more time. SL if a weekly candle closes above 17.

$LMND, can price recover and get back to the $30s?I'll be honest, this one I'm less confident about, but in terms of the analysis:
Earnings sent the stock price lower back into support and the 200DMA.
If price can stay above this region, then I think there's a possibility of a squeeze back higher into the $31 resistance.
First price needs to reclaim the $17 resistance.
Let's see if it can do that.

LMND Going Long !!!After reviewing NYSE:LMND options volume and activity i had my eye on it all week. I now see more volume and it broke a key level of support. I believe we can see a big upside after earnings this afternoon as long as the report is clean and positive.
