Roll Snake Eyes With Las Vegas Sands (NYSE:LVS)Las Vegas Sands Corp. (NYSE:LVS) is a leading casino operator who has had a rough 2014. The stock topped out in March, at $88.28 and has been steadily selling ever since. This points to major problems in Macau where most of their business is conducted. As you can see from the chart below, I have isolated a prime level to trade Las Vegas Sands Corp. (NYSE:LVS) on the long (buy) side. As you can see, LVS has a weekly gap fill, 200 Moving Average and 618 fib retrace. Therefore, to an active investor and trader like myself, this level is a no brainer long play for a straight shot down. Knowing and recognizing the best and most optimal points to enter a trade is of utmost importance. I know that by reading the charts properly I can achieve a high win to loss ratio, this means I have financial freedom and you can do the same.
LVS trade ideas

LVS - Falling knife about to find bottom on weekly supportPullback
Status: Watching
Total points:
Cost basis:
Stop:
First price target: $68
Technicals:
Horizontal S&R: yes
Channel S&R: yes
MA S&R: no
Pearson's R >= 85: yes
Price within Fib Ret..62: yes
Stochastic turn/crossover above 80%: yes
AO pullback >0<1.38: no
Fundamentals:
Next Earnings date: 11/15
IBD EPS Rating: 97
IBD SMR Rating: A

Roll The Dice And Go Long Las Vegas Sands Corp. (NYSE:LVS)Gaming companies are really taking it on the chin today as more bad news is coming out of Macau, and revenues continue to fall. Shares of Las Vegas Sands Corp. (NYSE:LVS) are no exception, as they are being taken down over 6%. LVS has had a terrible 2014 and the stock has entered into bear market territory, as it is down well over 20% from its high set back in March at $88.28. As a pro trader who studies charts on a daily basis, I have isolated an enticing level to go long Las Vegas Sands Corp. (NYSE:LVS) at $56.50 area. That is where this stock broke out last year and surged higher. So as Las Vegas Sands Corp. (NYSE:LVS) continues to fall, I would suspect that a retest of the break out level is imminent, and traders can roll the dice by going long to make money!
If you only read one email again, make sure it comes from the Elite Round Table. Our FREE market emails contain information that can actually make you money. Ask yourself, what email have you read that can do that? Answer = none. Join our list here.
Parm Mann
Elite Round Table
Follow me on twitter: @ParmMannTrader

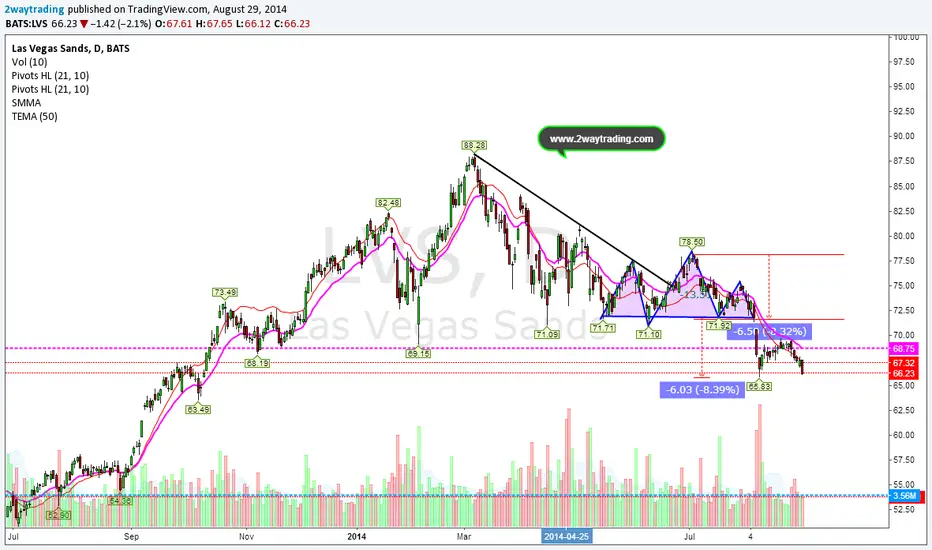
$LVS Completes projected target of Head and Shoulders topThe head and shoulder top was a classic and it achieved its measured target level.. Now what next? Check us real-time alerts www.2waytrading.com


LVS - Downtrend to ResumeRepublishing older chart with a few new annotations. Same short signal as last time. Once again faces significant resistance at the 63 RSI level, with failed breakout from rising wedge. Targeting $71.5.
6.27.14 - 1:10pm EST

Las Vegas Sands LVS - Rallied back to key resistance area - SellAnother shorting opportunity. See previous charts and follow-ups.
Tim

LVS Looks bearish as it is in a HnS pttn......w/ a tgt. of 60 for extension of the move......watch volume for confirmation

LVS gapped down into major support at $72Casinos stocks showing relative weakness as they trade below key moving averages. At the same time major indexes are at their highs.
It is hovering around 200 EMA at $73.22 and today gapped below, it could be new point of reference.
Major support at $72 which is in tact since February 2014. Break and hold below for few days could lead to some downside follow through.
Resistance is down trend line as bears keeping preassure on price as we can see with lower highs and recent swing high at $77.50.
Potential target could be at $64 which acted like support during September-October of 2013.

Las Vegas Sands - LVS - Daily - Rebound from oversold SELLCCI is back up to 0 and is a decent place to initiate shorts.
Big head & shouders top pattern signaling a change in trend from up to down.
Unfilled gap down below near the $60 projection going out to summer.
Cover when CCI reaches close to -200 (perhaps -190).
78 is key resistance. Use stops 3 ATR's above your entry and definitely beyond key resistance at 78. 75.97 last.
Targeting 70-68 initially.

Trade This Head & Shoulders Pattern: Las Vegas Sands Corp. (NYSEWith the stock market at recent highs, Las Vegas Sands Corp. (NYSE:LVS) is having trouble catching a bid higher. As technical traders, we seek to locate the best possible points to enter and exit a stock based on the charts and recognizing the best chart patterns. One of the best chart patterns, which is often interpreted or read incorrectly by most traders, is the "head & shoulders pattern." However, when this pattern is read properly, it presents a high probability trade.
Now, let's take note of Las Vegas Sands Corp. (NYSE:LVS), on a daily time frame chart. This daily chart has formed a head and shoulders pattern, take note of the chart below. Now, what we as traders need to watch is the "neckline." When that neckline is broken to the downside and the price of LVS confirms below it (learn what it means to "confirm" and more powerful trading techniques), that is the time to short the stock and look for a larger move lower. If LVS should break the neckline, the profit target to look for would be right around the $60 mark.
When trading, eliminating the noise is most important. Learn to read the charts properly as the pros do and you will position yourself to trade more consistently, with no guessing involved. Keep a close eye on LVS, we will be trading it!
Join us in the Elite Round Table to get our live trade alerts, when we enter and exit stocks for profit, step inside here.
Kristof De Block
Elite Round Table, Pro Trader

Las Vegas Sands LVS Daily ok to cover the short from near 78Banking the profit here on an extremely low risk entry near 78.

Las Vegas Sands LVS rallying back to resistance is setting up...Las Vegas Sands LVS Daily rally back to resistance is setting up a nice short sale zone marked by the red box.
I'll target the bottom end of the range of 70 initially and use a 3 ATR (11-day ATR) stop loss.
I'll reference the last chart so you can see this chart is untouched from the last one published.
The red box is the zone that leads up to the apex of the 3-day earnings triangle and a decent resistance zone.
76.77-77.89 as it is drawn, roughly.
Tim 5/12/2014 10:14AM EST


Las Vegas Sands LVS important support levels to knowLas Vegas Sands LVS
I'd like to show you how to find "Hidden support and resistance" that you would not otherwise be able to see from just a plain price and volume chart. The key here is to look at the price range around previous earnings reports.
What I have found is that the 3 days around earnings reports are big numbers to remember and that the market has a "memory" for. Traders and analysts and portfolio managers remember these prices and can leave orders standing at those levels far into the future (as much as 3 months or more). The one truism in stocks is that there are only 4 important days a year and those are when earnings are released, which is also when the company revises or updates its forecast for the coming quarter or year. So, it tends to be very important. If a stock moves away from an earnings report, it will still be important if it revisits that level again.
So, here is what you do: Form a triangle around the lowest low to the highest high from the day before earnings to the day after earnings. The mid point of this triangle will be important support or resistance for the following quarter, but can have importance even after that. See in this chart too, there is a great example in February this year.
I can't say enough how essential it is to know these price levels as a technical analyst, trader or portfolio manager. Once everyone has this information, it will become less valuable but for NOW, while it is barely used as an indicator or a system for generating support and resistance, it will be powerful and you can see how it is from this chart.
For a trade, I will go short LVS going under 78 if it can spend an entire day under 78. I might consider going long here at 79.47 with a stop at 77.80, risking 1.67 points to make a possible 3.53 move to 83 (the midpoint from the high at 88 to the earnings support at 78).
Best regards,
Tim 10:23AM EST Tuesday, May 6, 2014


LVS - Looking to Breakout to Previous HighsPotential breakout on the horizon for LVS. Price has been consolidating after a strong breakout. Supported by 8 dma and trend line. Look for a break of the upper descending trend line then through it's 52-week high at $73.49.
Historically, LVS has presented a strong amount of Relative Strength to the market so I expect this trend to continue as long as the market can hold up.
December option plays should pay nicely given the current levels of volatility.

$LVS Classic Topping Tail Las Vegas Sands Corp. (NYSE:LVS) surged in early trading, only to give it all up into the close. The stock hit a new 52 week high early and then was blasted lower as the markets fell on worries about the debt ceiling. The stock is extended and finally today has put in a topping tail. A topping tail is a technical signal of a top. Look for downside in the coming days. It is interesting to see this sell signal appear just days before Las Vegas Sands releases earnings on Thursday, October 17th, 2013.
Gareth Soloway
Chief Market Strategist
www.InTheMoneyStocks.com
