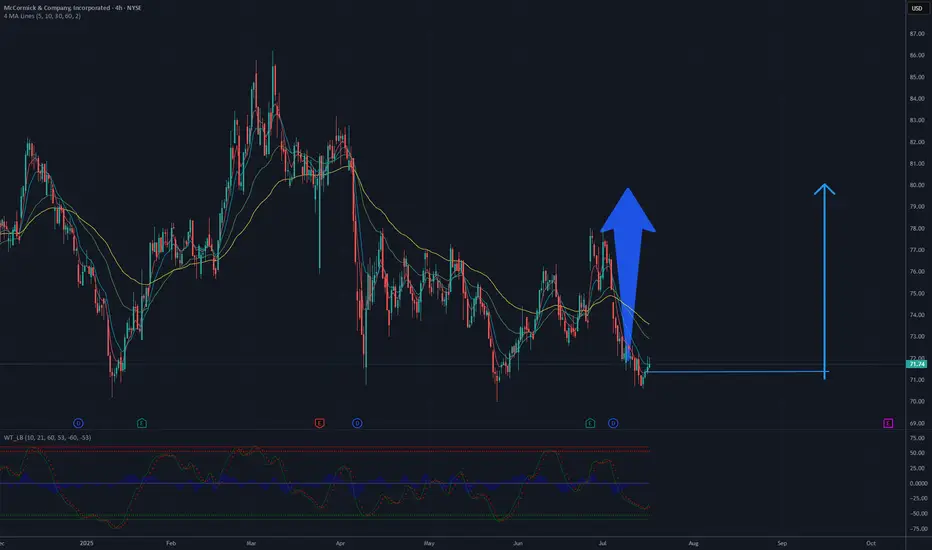
Ready for 80 USD? Time to grow for MKCThe chart analysis for this stock suggests a potential rise to 80 USD based on current technical patterns. The 4-hour chart shows a recent downtrend following a significant peak, with the price currently hovering around 71-72 USD. A key support level is evident near 70 USD, which could serve as a foundation for a potential rebound. The moving averages, including the 50-day and 200-day, indicate a prior bullish trend, and the current consolidation phase might precede another upward move.
Breaking through the resistance at 75-76 USD, a previous high, could signal the start of a new upward trend. With increased buying volume and bullish candlestick patterns, the price could target 80 USD, a notable psychological and technical resistance level. The RSI, currently in a neutral zone, could support this scenario if it begins to rise, indicating growing momentum. However, caution is advised, as a break below 70 USD support could negate this outlook and lead to further declines.
Potential TP: 80 USD
MKC trade ideas
MKC🧩 Chart Structure & Trend
The chart shows a bullish breakout from a short-term consolidation pattern, confirmed by a recent bounce from the uptrend support line (red ascending trendline).
The price is currently hovering near the entry level at 76, suggesting a good risk-to-reward setup if momentum continues upward.
🛡️ Risk Management
Stop Loss is well-placed below the trendline and key support level at 72.55. This helps limit downside risk if the breakout fails.
The risk from entry (76 to 72.55) is 3.45 units, and the reward (82.96 – 76) is 6.96 units, giving an R:R ratio of ~2:1, which is favorable.
📊 Technical Analysis Summary
Entry Point: 76
Stop Loss: 72.55
Target Zone: 82.50 – 82.96

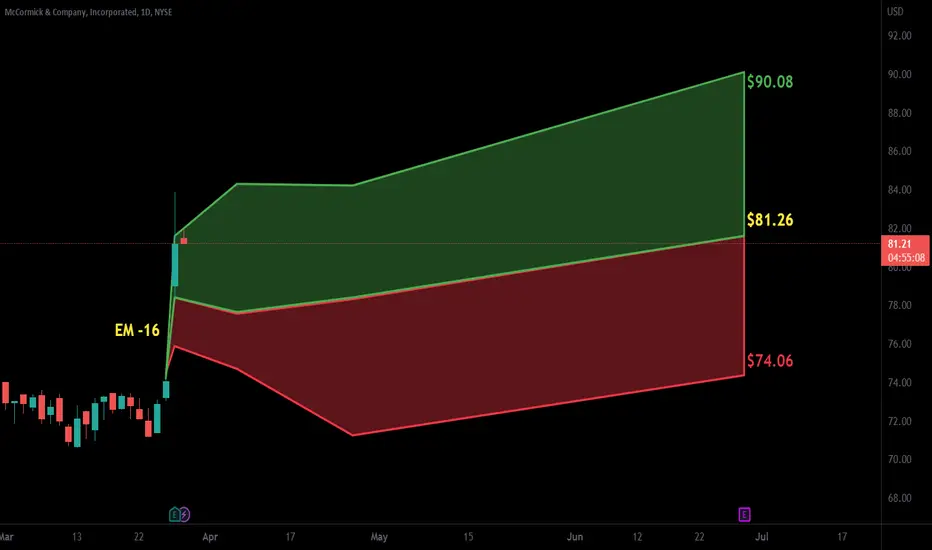
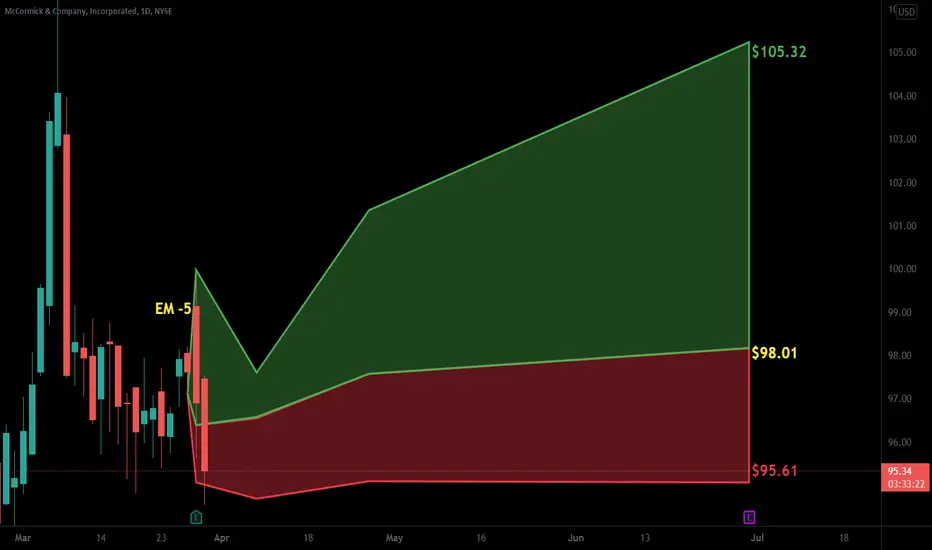
$MKC with a bullish outlook following its earnings #StocksThe PEAD projected a bullish outlook for NYSE:MKC after a positive over reaction following its earnings release placing the stock in drift B with an expected accuracy of 50%.

MKC McCormick & Company Options Ahead of EarningsAnalyzing the options chain and the chart patterns of MKC McCormick & Company prior to the earnings report this week,
I would consider purchasing the 85usd strike price Calls with
an expiration date of 2024-10-18,
for a premium of approximately $1.45.
If these options prove to be profitable prior to the earnings release, I would sell at least half of them.

Pantry Staples: Macro Fib SchematicsGeneral Mills, Kellogg, Campbell, Hershey, Smuckers, Sysco, McCormick & Company, and ConAgra are a handful of the largest American pantry/snack favorites.
These Fib Schematics look pretty good and are easy to decipher. This makes this a good idea other than the fact that I should have grouped my tow food ideas differently. I have another Food Idea linked below with the rest of the Big Food Players.

$MKCNot Fianancial advice.
NYSE:MKC currently in a downtrend
on the monthly and on the quarter. fail to hold the yellow line Heading for the next target at $56. Please be cautious .
#subscribe

MKC McCormick & Company Options Ahead of EarningsAnalyzing the options chain and the chart patterns of MKC McCormick & Company prior to the earnings report this week,
I would consider purchasing the 75usd strike price Calls with
an expiration date of 2023-10-20,
for a premium of approximately $2.53.
If these options prove to be profitable prior to the earnings release, I would sell at least half of them.
Looking forward to read your opinion about it.

Earnings JournalAT A GLANCE
Simplistic Analysis: reversion up to the mean.
Trade Type: Touch & Go don't wait for a close.
Research Depth: technical glance only.
Earnings Anticipations: positive surprises for EPS & Revenues.
Surprise-confidence on a scale of 0-5: 2

MKC - Sustained Up ChannelA double bottom in green box has formed at the bottom of an up channel on the daily chart for MKC.
I expect this to react bullishly to this formation and push price back up to the higher highs of the up channel.
Bullish.

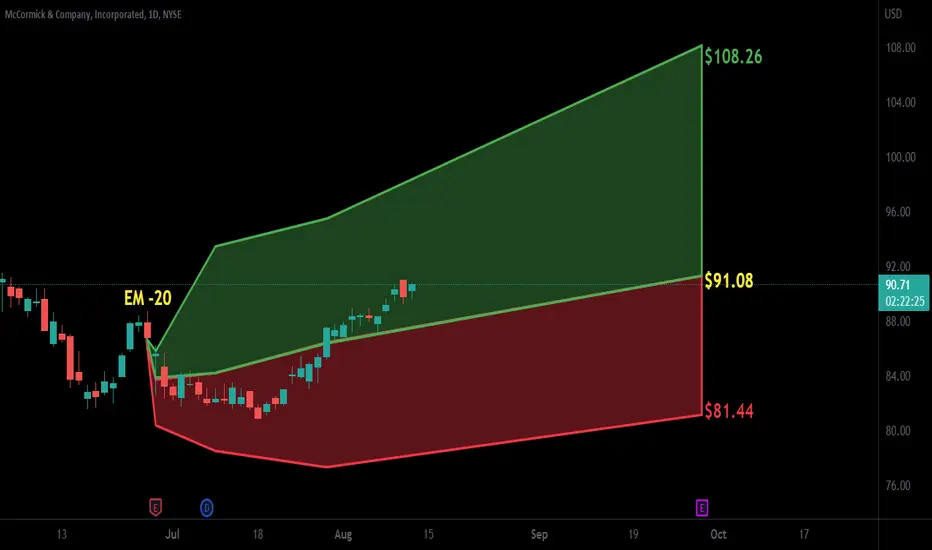
$MKC with a bullish outlook following its earnings #StocksThe PEAD projected a bullish outlook for $MKC after a positive under reaction following its earnings release placing the stock in drift A with an expected accuracy of 87.5%.
MKC MAR75/FEB65 DIAGONAL PUTBEAR RALLY SET UP
I've had MKC on my watchlist for about a week now. ON January 18th, the 20 day crossed the 50 day and made a new swing low on January 20th. Since then, it had a small bear rally back to prior support resistance of 79.09ish which it hit on the 24th. On the 25th, it traded below the previous day's low, however I waited one more day because I didn't want to get into this before earnings. With the gap down today, I executed my trade as there could be more down side to come based on the technicals.
I won't have any stops since I'm set up for max loss and risking less than 2% of my portfolio.
I drew a downward trendline/channel from the high of March 2022. On the hour chart, it recognized this channel from about April 20th 2022, to about the middle of May before it sold off. This only has monthly contracts. I was originally going to select the 70 strike, but my idea is that it falls back into this downward channel within the next three weeks to reach my 65 target by the 17th of February.
Position management strategies when the stock goes lower
If this goes lower below my 65 target, I'll close out the entire combo and move on to my next trade.
Position management strategies when the stock goes sideways
If this goes sideways, I'll let my 65 strike expire and hang on to my 75 strike until March until it reaches my 65 target.
Position management strategies when the stock goes higher
If this goes higher, I'll let it all expire worthless since I'm set up for max loss.
Position management strategy at expiration
Come February 17th, if this is still above my 65 target, I'll hang on to my 75 strike until it does reach my 65 target. If we're at 65 or below 65 come the 17th, I'll close out the entire combo.

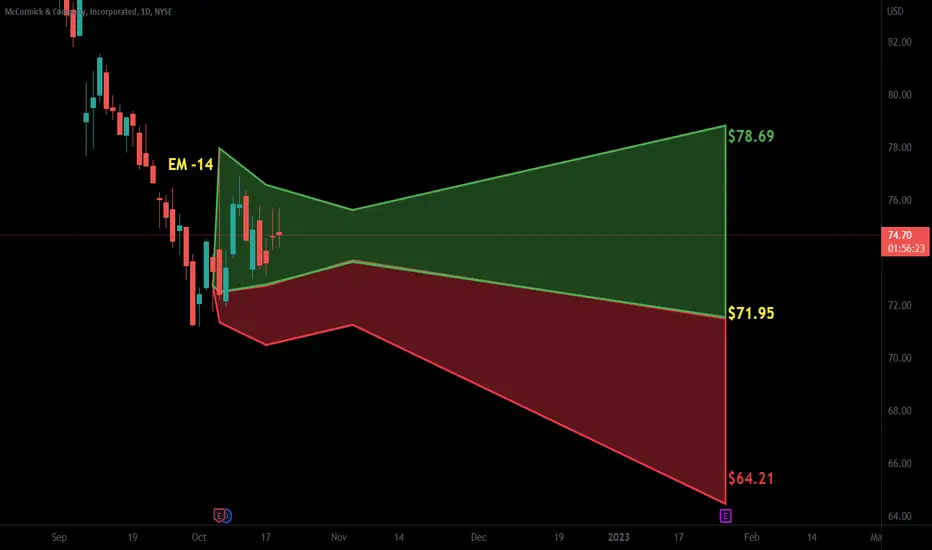
$MKC with a Bearish outlook following its earnings #Stocks The PEAD projected a Bearish outlook for $MKC after a Negative over reaction following its earnings release placing the stock in drift C with an expected accuracy of 62.5%.

$MKC: Long term acquisition level$MKC has a very nice setup to go long here, one of the solid long term names to buy when they look ugly as per @timwest . I'm buying shares for my daughter here, looks like it's a solid setup overall.
Best of luck!
Cheers,
Ivan Labrie.

Sell MKC Expecting to go back to 81 (target 1) and then to 72 (target 2)
Resistance at 200 SMA plus tech indicator

Long ideaWhat a beautiful structure.
Base channel & its median respected, retracement 62%.
Need to take out 93 to confirm the impulse.
trade safe

$MKC with a Bearish outlook following its earnings #Stocks The PEAD projected a Bearish outlook for $MKC after a Positive over reaction following its earnings release placing the stock in drift B with an expected accuracy of 50%.
MKCNo idea what this is
Murican food?
Corn syrup?
Koolaid?
Quadruple cheesburgers?
Anyway i longed me some
GRI 2022
Chart- geometric
Indi- bull div

$MKC with a Bullish outlook following its earnings #Stocks The PEAD projected a Bullish outlook for $MKC after a Negative Under reaction following its earnings release placing the stock in drift D with an expected accuracy of 80%.
MKC - Double Bottom Along Trend Line Dominant trend line in solid white
Similar double bottom formations can be seen in green rectangles
Continuation pattern

MKC Weekly 200MA Support The 200MA support is too strong within this one
Has not been broken since its inception (1976)
Very reliable long

27/5/2022 NYSE (MKC)Short (Entry Price) within the sell zone area and exit (Stop Loss) above the red line. Can take profit at the suggested Target Price.
Entry Price: $92.43 / $93.18
Target Price: $91.18 / $91.84
Stop Loss: $94.52

$MKC with a Neutral outlook following its earnings #Stocks The PEAD projected a Neutral outlook for $MKC after a Positive over reaction following its earnings release placing the stock in drift B with an expected accuracy of 100%.
McCormick & Company (MKC) - Now Offering A Great Short SetupPrice action would suggest this is a rather good short opportunity on MKC. Risk/reward here is excellent.
