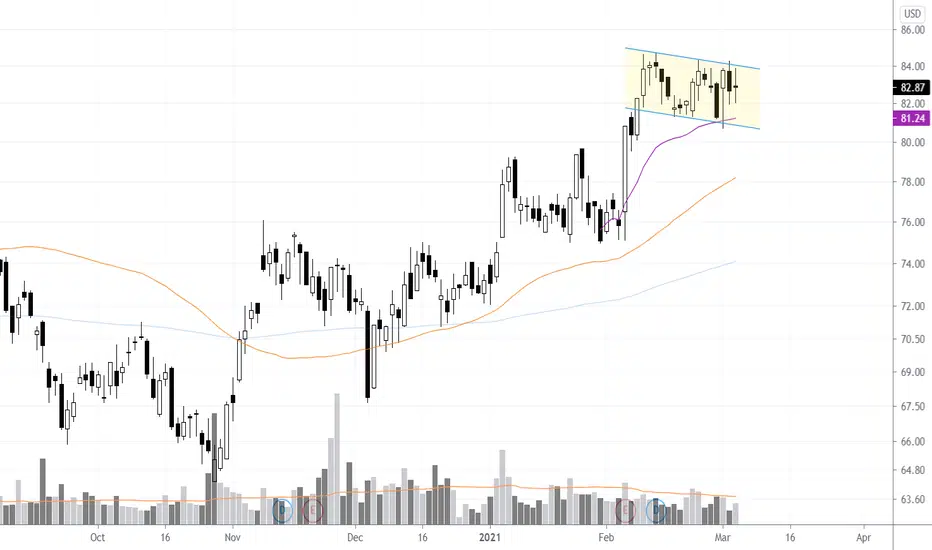
$MMS bull flag setupImpressive stock action by Maximus. A promising long trade setup:
1- Noticeable strong relative strength to the broader market
2- Consolidating gains right above ATHs set back in September 2019
3- A resumption of the upwards trend will send the stock to new ATHs
Next report date
—
Report period
—
EPS estimate
—
Revenue estimate
—
5.05 USD
306.91 M USD
5.31 B USD
55.64 M
About Maximus, Inc.
Sector
CEO
Bruce L. Caswell
Website
Headquarters
McLean
Founded
1975
FIGI
BBG000BC5WJ4
MAXIMUS, Inc. engages in the operation of government health and human services programs, and the provision of technology solutions to government. It operates through the following segments: U.S. Services, U.S. Federal Services, and Outside the U.S. The U.S. Services segment offers business process services (BPS), appeals and assessments, and related consulting work for U.S. state and local government programs. The U.S. Federal Services segment delivers end-to-end solutions and includes appeals and assessment services, system and application development, IT modernization, and maintenance services. The Outside the U.S segment provides BPS for international governments and commercial clients. The company was founded by David V. Mastran in 1975 and is headquartered in McLean, VA.
Related stocks
$MMS with a bearish outlook following earnings releaseThe PEAD projected a bearish outlook for $MMS following a negative under reaction with the stock being placed in Drift D
If you would like to see the Drift for another stock please message us. Also click on the Like Button if this was useful and follow us or join us.

Maximus Awarded $13 Million OPM Contract for Retirement and InsuMMS: MAXIMUS
2020-07-20 09:00:00
Maximus Awarded $13 Million OPM Contract for Retirement and Insurance Services Assistance

MMS to acquire certain assets of General DynamicsMMS: MAXIMUS
2018-10-09 08:00:00
MAXIMUS Signs Definitive Agreement to Acquire U.S. Federal Citizen Engagement Centers for $400 Million in Cash

MAXIMUS Awarded North Carolina Department of Health and Human SMMS: MAXIMUS
2018-08-14 06:30:00
MAXIMUS Awarded North Carolina Department of Health and Human Services Contract for Medicaid Managed Care Enrollment Broker Services

MMS Detected possible contract awarded!!!MMS: maximus inc
2018-06-26 06:30:04
Detected possible contract awarded

MAXIMUS INC. - $MMS - Dip or Falling Knife? $MMS ER miss of $0.02 w/ Revenue miss of -1.5% has dipped pretty nicely. I've purchased 3x 6/15 - $65.00 calls hoping for a rebound.
$MMS is currently below the 255 day Linear Regression Line by more than 1x standard deviation (probably more like >2x stddev).
Price target to sell of $62.70 or so f


See all ideas
Summarizing what the indicators are suggesting.
Neutral
SellBuy
Strong sellStrong buy
Strong sellSellNeutralBuyStrong buy
Neutral
SellBuy
Strong sellStrong buy
Strong sellSellNeutralBuyStrong buy
Neutral
SellBuy
Strong sellStrong buy
Strong sellSellNeutralBuyStrong buy
An aggregate view of professional's ratings.
Neutral
SellBuy
Strong sellStrong buy
Strong sellSellNeutralBuyStrong buy
Neutral
SellBuy
Strong sellStrong buy
Strong sellSellNeutralBuyStrong buy
Neutral
SellBuy
Strong sellStrong buy
Strong sellSellNeutralBuyStrong buy
Displays a symbol's price movements over previous years to identify recurring trends.
Frequently Asked Questions
The current price of MMS is 72.91 USD — it has decreased by −1.90% in the past 24 hours. Watch Maximus, Inc. stock price performance more closely on the chart.
Depending on the exchange, the stock ticker may vary. For instance, on NYSE exchange Maximus, Inc. stocks are traded under the ticker MMS.
MMS stock has fallen by −2.42% compared to the previous week, the month change is a 1.41% rise, over the last year Maximus, Inc. has showed a −21.21% decrease.
We've gathered analysts' opinions on Maximus, Inc. future price: according to them, MMS price has a max estimate of 116.00 USD and a min estimate of 90.00 USD. Watch MMS chart and read a more detailed Maximus, Inc. stock forecast: see what analysts think of Maximus, Inc. and suggest that you do with its stocks.
MMS stock is 2.48% volatile and has beta coefficient of 0.29. Track Maximus, Inc. stock price on the chart and check out the list of the most volatile stocks — is Maximus, Inc. there?
Today Maximus, Inc. has the market capitalization of 4.11 B, it has decreased by −2.27% over the last week.
Yes, you can track Maximus, Inc. financials in yearly and quarterly reports right on TradingView.
Maximus, Inc. is going to release the next earnings report on Aug 7, 2025. Keep track of upcoming events with our Earnings Calendar.
MMS earnings for the last quarter are 2.01 USD per share, whereas the estimation was 1.38 USD resulting in a 45.65% surprise. The estimated earnings for the next quarter are 1.53 USD per share. See more details about Maximus, Inc. earnings.
Maximus, Inc. revenue for the last quarter amounts to 1.36 B USD, despite the estimated figure of 1.29 B USD. In the next quarter, revenue is expected to reach 1.32 B USD.
MMS net income for the last quarter is 96.57 M USD, while the quarter before that showed 41.20 M USD of net income which accounts for 134.41% change. Track more Maximus, Inc. financial stats to get the full picture.
Yes, MMS dividends are paid quarterly. The last dividend per share was 0.30 USD. As of today, Dividend Yield (TTM)% is 1.65%. Tracking Maximus, Inc. dividends might help you take more informed decisions.
Maximus, Inc. dividend yield was 1.29% in 2024, and payout ratio reached 24.04%. The year before the numbers were 1.50% and 42.54% correspondingly. See high-dividend stocks and find more opportunities for your portfolio.
As of Aug 2, 2025, the company has 41.1 K employees. See our rating of the largest employees — is Maximus, Inc. on this list?
EBITDA measures a company's operating performance, its growth signifies an improvement in the efficiency of a company. Maximus, Inc. EBITDA is 660.82 M USD, and current EBITDA margin is 11.82%. See more stats in Maximus, Inc. financial statements.
Like other stocks, MMS shares are traded on stock exchanges, e.g. Nasdaq, Nyse, Euronext, and the easiest way to buy them is through an online stock broker. To do this, you need to open an account and follow a broker's procedures, then start trading. You can trade Maximus, Inc. stock right from TradingView charts — choose your broker and connect to your account.
Investing in stocks requires a comprehensive research: you should carefully study all the available data, e.g. company's financials, related news, and its technical analysis. So Maximus, Inc. technincal analysis shows the buy rating today, and its 1 week rating is neutral. Since market conditions are prone to changes, it's worth looking a bit further into the future — according to the 1 month rating Maximus, Inc. stock shows the sell signal. See more of Maximus, Inc. technicals for a more comprehensive analysis.
If you're still not sure, try looking for inspiration in our curated watchlists.
If you're still not sure, try looking for inspiration in our curated watchlists.