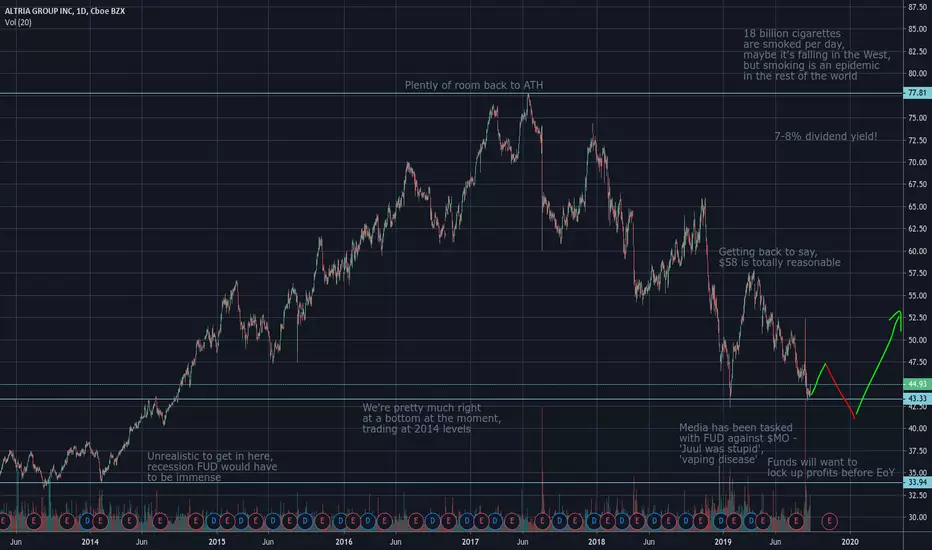
Beaten down too muchI think the media FUD about vaping and a possible end-of-year recession fright can bring it even lower. Idk, maybe you can get it for $39, but if you zoom out it's pretty clear Altria's cheap even today.
Feels like a solid pick for those who appreciate slow and steady gains.
MO trade ideas


EngulfingThe current candle is engulfing the previous green onces. The momentum is increasing again.

MO WeeklyA better view of previous chart's levels, as they're mostly- daily/weekly+ charted (posted hourly tf)

MOPartial long entries today.. 43.80 range holding, for now, looking to see if we can get a curl up 30c or so before today's close. Watching for that small descending triangle intraday, We'll be looking for support levels below hold next week. Some decent support was broken, but it's been reclaimed in the past with fakeouts, so am not concerned.
Looking at a weekly close range to gauge potential fakeout. If a close below 44.24 then lowest close in many years. 2 weeks from ex-div, so expecting a bottom to be hit and then some large buying power and short covering in the coming week-2 weeks. 38+-43(mid) range I fully expect to hold. It's a wide range, but strong. Future announcements concerning the merger or regulatory measures can keep some on edge. Get in before 9/13 for that 84c dividend. 1to1 at these prices puts it higher 50's with PM. Investors hopeful of .78 PM to 1 MO, but details, if any, are far out. Negative JUUL news helping shorters, again, expect Short covering.


ALTRIA GROUP. Mo. #MO, #cannabisMarket sentiment $55.00.
I am waiting for drop till $41.00 abd then buy.
If you want to get best signals join our channel in telegram. You'll get exclusive info.
Our telegram channel is absolutely Free.

ALTRIA GROUP INCI am Playing the dividend yeild Theory. Looking for a 7% dividend Yeild
The Proyections made here ar only for record keeping of my trades. The do not inted any Sugestions.

MO Long Idea Potential 30% upside on MO after reclaiming of support level.
Price currently testing POC, once we break it move upside should come.


lower "highs"when it was pure play cigs, I liked it. now dilutive juul and pot purchases, higher debt service. lower highs, trend break, shrinking sales. if they cant hold market share and pricing power, there aint much left to this story


highlighted this resistance in febi still think that vape and pot purchases are an admission of a company past its prime, I reluctantly feel there is more headwinds ahead

Chance to sell a good working PUT on AltriaThere is a support level around 54$ which was already tested beginning of April.
Stop should be arround 52$.
Next support is somewhere near 50$ which make the sell of a PUT very attractive.
From indicator perspective only my RVGI is bullish by crossing the 0 line.


Just practicing charting and technical analysisThis is not financial advice.
I expect MO to Fibonacci retrace to the golden pocket area (.618 - .65) and bounce off where we had previous resistance (a weekly and monthly level of significance).
Placing buy laddered buy orders from 48.91 to 47.82 is my idea. There is a chance price dips below the .65 into the liquidation zones a bit below. Set your stop loss according to your own risk.
Take profit at significant levels of resistance/support on the way up.

MO trading idea + Technical analysisA lot happening with this name.
Short case:
- Doji confirmation following the hanging man 6 days prior.
- Steep wedge pattern
- Extremely low VIX momentum
- RSI over-extended
- Negative divergences on lower time-frames
- Currently sitting at potential profit taking resistance of Inv. H&S
Long Case:
- Wedge is still intact
- Above 20, 50 and 200 MA on daily
- Increasing Volume
- RSI can stay Over-brought for as long as it wants
- No RSI divergences on Longer time frames (i.e Daily, weekly...)
NOTE: Nothing here is looking at Fundamentals of the company, only Tech.

$MO Altria weekly is it time to get in?Trading stock is not easy and n this case you will have to try to catch the 61.8% retrace break. A daily close next week above 57.10 will open the upside test of 62 level. Look for this daily break to enter the trade.

