$MOS Fertilizer market is rippingLove the cup and handle breakout here. Fertilizer market is ripping with CF and NTR both great trades for me already.
Trail those stop losses and lock in gains.
Happy Trading
Blue skies ya gotta buy
MOS trade ideas

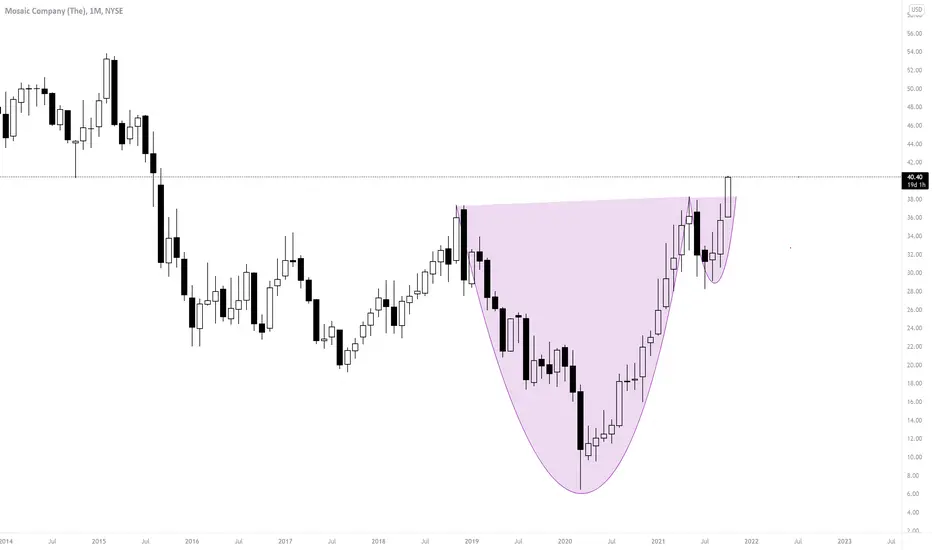
$MOS - Breaking outMOS breaking out of its flag. Needs further follow through and there is always the possibility of a failed breakout. With where materials are heading in next 12-24 months, this is a core position in my 2022 client portfolio.

$MOS 4 Months BaseNot a big fan of the volume pattern but $MOS working on a 4 months base around its 50 MA and put in 2 higher lows on the right side of the base. Nice low cheat that could work.

$MOS - Nice consolidationI enjoy watching a stocks RSI get stronger as the price maintains a good range. Meaning its being accumulated. This also has a buy rating at many firms including mine. I have been adding it for clients over the last couple months and will continue to.


Long MOS AND increase position at $27Great opportunity to buy The Mosaic Company at a discounted price.
If the market allows, add more at $27


MOS Trendline channel $MOS has been on a strong uptrend for past 52 weeks, retracing back to trendline and/or 20EMA support and bouncing off from there. Will hold on to this position till price drops to 50EMA, indicating a break in trend


MOS - Looks Like a Long Term Buy for 2021 on DipsLonger term chart shows this stock has plenty of room to the upside in the coming year.
Goodluck
Opinion only.

MOS Mosaic Corp.Very interesting set up,
Looking to sectors performance indexes it seems
Materials should do well
Take care at 37 but this one has a lot of potencial for this week
look at the weekly chart of this stock as well
this stock.
has always look for profesional advise
this are my guess
i ´m not a profesional adviser.
Trend is up, price action over MA20,MA50,MA100
Charlie
Good Luck


Looks like $MOS Got a New ChannelPlay this channel and see if it flips the resistance to support. NYSE:MOS


MOSBreaking higher, good earnings, good space for inflation going forward. Long or swing trade either one should work. Indicators rolling up.

MOS to go back down to bottom of rangeMOS has had a good run up since the low of $6.50 at March'20.
It didn't have much pullback from $6.50 to $33. Nothing lasts forever. Judging from the Weekly chart, $33 area has a been strong resistance and it doesn't look like it will break above it any time soon.
We should be able to enter at a better price when it retest the $33 resistance again.
Target profit 1 is $25, just to lock in some profits.
Target profit 2 is $22-23, the lower band of the range.
We can look to buy when it is at the lower band, but that will be another analyze...depending on the price action then.
Disclaiminer: I'm not giving any trading and investing advice. Just sharing my chart observations.
If you have any symbols that you'd like me to analyze, feel free to drop me a comment.
Thanks!


The MOSAIC Folder DailyHey traders, MOSAIC is in a fake bearish push with a large upside down candle and a large return of traded buy volume. On TIMEFRAME M1 shows a hammer candle shape returning with a fake return of traded sell volume, it left on its last low point to swallow to come back to check the top of the equilibrium zone. Great propability of breaking out the price with the momentum then at the same time the zone to fit in the one above and interfere with the coming top.
With a test of the bollinger high then rising to the last high point, but enough buying power to breakout a level in the equilibrium zone for now.
Please LIKE & FOLLOW, thank you!
