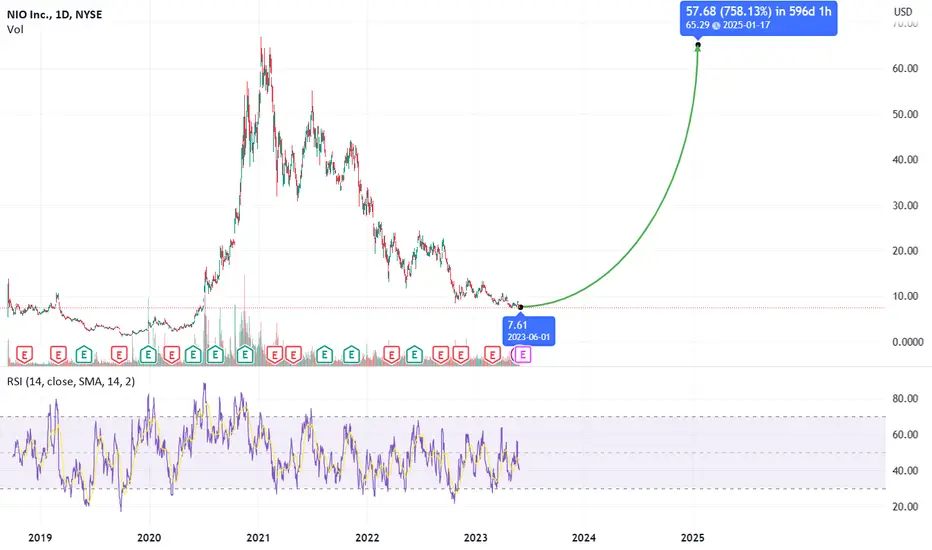
BUY NIO BUY EARNINGS CALLSStarted a 5 year long position today will attempt to enter full position below $10. Today I entered large earnings gamble on call options.
NIO trade ideas
NIO longs for an earnings playNIO has earnings coming up at a good time when the China ecomony is recovering from
the lockdown and holding interest rates down to support economic expansion. NIO is also very
busy selling their EVs in Scandinavia. On the one-hour chart, NIO has risen above the demand/
support zone and seems to be retracing the recent downtrend. The indicator shows momentum
and RSI to have crossed the 50 line but money flow is lagging. Volume is picking up in the last
few weeks and price has now crossed over the POC line of the volume profile as another sign
of bullish buying pressure and dominance. I will trade a long trade in NIO now before the
earnings expecting good price action and volatility will yield decent profit in the trade.
The stop loss will be below the support zone and the first TP at $8.00 being the top of the
high volume area of the profile while the 2nd TP will be $8.50 and final at $9.00.

NIO Stock: Is a Spring Reversal Imminent?I had been shorting NIO stock due to the very apparent downtrend as portrayed by the 50 and 100 EMA. However, I noticed that the swings from high to low were getting narrower, signaling a loss in momentum. Throwing some zones on the chart, you can see a small trading range has formed.
I compared the Wyckoff accumulation schematic to the NIO chart. The schematic calls for hard selling followed by strong buying and consolidation. In NIO, there was hard selling in March and May, with strong volume. This indicates that there were large interests selling their shares during this time.
However, in November 2022, we saw a selling climax with strong volume. This was followed by a bounce in price called the automatic reaction (AR). This bounce is likely due to institutional investors buying up the supply. The secondary test, which occurred on expectedly lower volume, further supports this theory.
The millionaire-making question is whether we have seen an ST in phase B. If we have not, it is likely that the trend will continue lower to the sub-$5 range. However, if we have seen an ST, it is likely that we are seeing a spring. A spring is a shakeout before institutional investors decide to take the stock higher.
I think it is important to note the increase in volume during the month of May when the spring started. High volume during a spring suggests that big money is scooping shares for cheap. I believe that this is the perfect time for institutional investors to swoop in and use earnings as an excuse to push the stock higher.
What are your thoughts?

NIO Limited (NIO)Shares in NIO limited (symbol ‘NIO’) have been trading in a declining channel throughout the first quarter of 2023. The company is expected to report its earnings for the fiscal quarter ending March 2023 on Friday 9th of June before market open. The consensus EPS is $-0,22 compared to the result for the same quarter last year of $-0,18.
‘The expectations of the negative EPS only makes sense since the company is yet to be profitable. Investors will want to watch for updates on the company’s global expansion. Nio has a relatively large portion of the Chinese market but is facing increasing domestic competition, although in mid May Ford announced that they will be scaling down their EV operations in China which is considered welcome news for NIO. This has the company planning to expand further into Europe while any positive news about this expansion could also be beneficial to NIO stock.‘ said Antreas Themistokleous, an analyst at Exness
On the technical side the price has been trading in a declining channel for the first quarter of the year with the last retest happening last week where the price found sufficient resistance around the $8,50 price area where was the upper band of the Bollinger bands, the 50 day SMA and also the upper boundary of the channel.
The 50 SMA is still trading well below the 100 SMA indicating that the bearish momentum is still in effect while the Stochastic oscillator is close to the extreme oversold levels and possibly signaling a correction might be visible in the coming sessions. This might take some time to happen though since volatility is kind of slowed down as we can see a contraction of the Bollinger bands close to its 20 SMA line.

NIO Limited (NIO)Shares in NIO limited (symbol ‘NIO’) have been trading in a declining channel throughout the first quarter of 2023. The company is expected to report its earnings for the fiscal quarter ending March 2023 on Friday 9th of June before market open. The consensus EPS is $-0,22 compared to the result for the same quarter last year of $-0,18.
‘The expectations of the negative EPS only makes sense since the company is yet to be profitable. Investors will want to watch for updates on the company’s global expansion. Nio has a relatively large portion of the Chinese market but is facing increasing domestic competition, although in mid May Ford announced that they will be scaling down their EV operations in China which is considered welcome news for NIO. This has the company planning to expand further into Europe while any positive news about this expansion could also be beneficial to NIO stock.‘ said Antreas Themistokleous, an analyst at Exness

NIO AnalysisPrice consolidated since my last analysis. Since price is still within this bullish order block, my original expectation remains unchanged, expecting price to go higher, mitigate the bearish POI at 10.03 and fill the fair value within.

NIO: Going to $5-8. Bulls will be miserable all year :(It seems like NIO stock has fallen a lot, doesn't it? Well guess what... it should fall another 60%+ from here.

$NIO - $4.74 is a first price target bearish outlookThe downward channel I still intact, lower highs lower lows still playing out with many bearish flags setting up. There is a major gap at around $4.74 that needs to be filled.

One of the best looking charts out there...This looks like a lay up . Clean invalidation points if this is an Ending diagonal pattern.
Want to see a motive wave and break of top trend line of the diag.
Then potential full send

NIO: Buy ideaOn NIO as you see on the chart we have the breakout of vwap and the breakout of the resistance line so it's mean that we will have a big probability to have an uptrend.Thanks.

NIO: Sell ideaAs you see on the chart we will have a big probability to have a downtrend because we have the breakout with force the support line and vwap.Thanks!

NIO $NIO Long#NIO NYSE:NIO
📈Chart Pattern: Falling wedge
🫵Perspective: Long
💔Stop loss: Breaking $ 6.95
NYSE:NIO SKILLING:NASDAQ AMEX:SPY

NIO can find bottom near 7.00$NIO is respecting trend-lines of this beautiful wedge and showing some strength on 4h and 1d RSI. I think it may find local bottom here, reverse & breakout from the wedge. I'm looking to bid 7.00$ area if given or after it breaks out to swing long up to 14.00$

NIO AnalysisPrice did not play out as analyzed last week. Price retraced from the current bullish POI and failed to fill the fair value gap before coming back down. This might be a start of Wyckoff accumulation schematic before the earnings next Friday. Price would probably consolidate here until then.

NIO: Sell ideaSell idea on NIO as you see on the chart because we have the breakout with force the vwap indicator and also the breakout of the support line so it's mean that we will have a big probability to have a downtrend.Thanks!

NIO breakout from descending wedge NIO is shown on a 4H chart. It has been downtrending for 3 months. Howver, April and May
has high relative volume trying to reach the capitulation of a bottom. Thursday May 4th
marked a near term bottom. NIO is now rising and breaking out of a falling wedge drawn onto
the chart. It has crossed over the POC line of the volume profile ( This is the price level of
the highest volume of trading). Price is impending a mean anchored VWAP. Relative strength
has spiked. With this confluence of bullish signals, I have taken a long position which has
appreciated 4.6% in the first half of the trading day having opened the position in the pre-
market. I will now take a trade of call options striking $ 7.00 DTE 7/21. The rising dollar
strength has confounded TSLA's sales in China and the Nordic countries. NIO is on the ready to
pick up the slack.

NIO AnalysisPrice playing out nicely as analyzed last week, giving us a mitigation of the bullish POI and a huge spike to the upside of 14.49%. Target for this bullish move should be to fill the fair value gap at 9.45 before we see a bearish retracement.

NIO: Buy ideaOn NIO as you see on the chart we have a buy idea because we have the breakout with force the vwap indicator and also the breakout of the resistance line so it's mean that we will have a big probability to have an uptrend.Thanks!

NIO The stock is considered in the areas of the final bottoms, a wave that considers the entry areas for the investor to be safe, investment centers, we would have a fluctuation here with a range of 1 less, but the prices I see are golden for investment entry

Expecting a bounce at this level.Expecting a bounce at this level from $7.95. Its right at the trend line support since mid 2019.

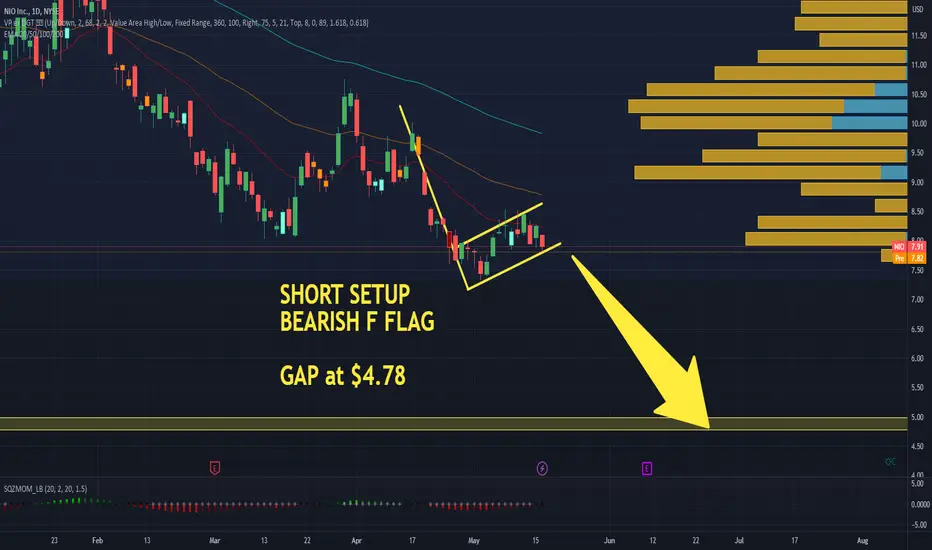
$NIO - BEARISH Flag Setup to $4.78Nio has finally setup a nice BEARISH F FLAG. Watch for a break below the flag. Short at the break and follow thru with a new leg extension. There is a gap that needs to be filled at $4.78

NIO AnalysisPrice consolidated since my last analysis. No changes to my expectations, expecting price to rally towards the bearish POI at 10.03 next as the target after mitigating the current bullish POI.
