NYA chart Posted The signal for the Top is hours away .7/24/7/26The chart posted is my work based on the golden ratio and SPIRAL calendar work .We will be hit by one of if not the highest ever solar storms from 7/24 to 7/26 I will be re shorting into this date And will look for the markets worldwide to see a massive event .I have been talking a massive earthquake and the markets to begin a drop into OCT 10 to the 20th . best of trades .Wavetimer
NYA trade ideas

NYA Hourly 5th of the 5th If the Bull market is to advance we can NOT drop below .382 of the rally from 4/7 2025 Were I said 4835 was wave 4 in Super cycle .it is this simple Which is the 200 day avg BTW !!!!!!!best of trades WAVETIMER

WEEKLY NYA turns and E Wave see 12/8 2024 forecast The chart of the NYA I have not changed or relabeled anything since 12/8 2024 best trades WAVETIMER

NYA 5of 5 of 5 into the spirals and solar peak Mayan 1987The chart posted has Not had one labeling changed since My view 11/29 12/6 cycle peak

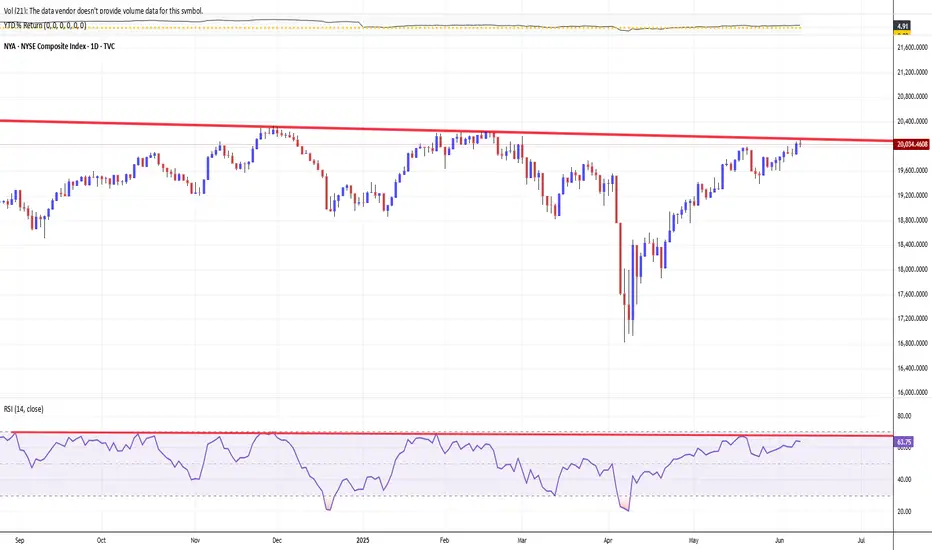
NYSE COMPOSITE INDEX. BACK TO 20 000 MARK — KEY RESISTANCE LINEThe NYSE Composite TVC:NYA is a stock market index, that covering all common stock listed on the New York Stock Exchange, including American depositary receipts, real estate investment trusts, tracking stocks, and foreign listings.
Over 2,000 stocks are covered in the index, of which over 1,600 are from United States corporations and over 360 are foreign listings.
However foreign companies are very prevalent among the largest companies in the index: of the 100 companies in the index having the largest market capitalization (and thus the largest impact on the index), more than half (55) are non-U.S. issues.
Thanks to many non-U.S. components, NYSE Composite index shows nearly 5 per cent return in 2025 so far, outperforms major U.S. stock indices like Dow Jones Industrial (+0.24%), S&P500 (+1.91%), as well as Nasdaq-100 (+3.21%).
Trade negotiations and tariff expectations have been central drivers of the NYSE Composite Index's recent recovery, shaping both market sentiment and underlying corporate fundamentals.
Trade Negotiations. Market Sensitivity and Relief Rallies
Financial markets, including the NYSE Composite, have reacted sharply to developments in trade negotiations. Historically, when trade talks break down or new tariffs are announced, U.S. stocks tend to sell off due to concerns over higher costs, supply chain disruptions, and reduced global demand. Conversely, when negotiations resume or tariffs are delayed, markets often rebound. For example, during the 2018–2019 U.S.–China trade war, U.S. stocks experienced heightened volatility, but rallied strongly after the announcement of the Phase I trade deal, as uncertainty eased and the threat of further escalation diminished. This pattern has repeated in 2025: the NYSE Composite has staged recoveries following signs of progress in trade talks or delays in tariff implementation, as investors anticipate less disruption to global commerce and corporate earnings.
Tariff Expectations. Impact on Earnings, Valuations, and Sentiment
Tariffs directly affect corporate earnings by raising input costs for companies that rely on imported goods. According to Goldman Sachs Research, every five-percentage-point increase in the U.S. tariff rate is estimated to reduce S&P 500 earnings per share by roughly 1-2%. If companies absorb these costs, profit margins are squeezed; if they pass them on to consumers, sales may decline. The NYSE Composite, which tracks a broad swath of U.S. and international companies, is similarly exposed.
Expectations around tariffs also influence equity valuations.
Elevated policy uncertainty—driven by unpredictable tariff announcements—raises the risk premium investors demand, often compressing price-to-earnings multiples and weighing on stock prices. When clarity emerges, such as the announcement of a tariff pause or the prospect of a negotiated settlement, uncertainty recedes, and valuations can recover, fueling index gains.
The Role of Policy Announcements and Market Psychology.
Trade policy announcements have acted as economic shocks, affecting global trade relationships and growth forecasts. For instance, after the U.S. announced new tariffs in early 2025, recession odds rose and GDP growth forecasts were slashed, prompting a broad market sell-off. However, the subsequent announcement of a 90-day tariff pause and renewed negotiations led to a stabilization and partial recovery in equities, as investors reassessed the likelihood of a severe downturn.
Market psychology amplifies these moves.
As trade rhetoric intensifies, investor sentiment can become excessively pessimistic, sometimes overshooting the actual economic impact of tariffs. This creates conditions for relief rallies when negotiations show progress or when the tariff outlook becomes less severe than feared.
Technical challenge
NYSE Composite index has experiencied record values on Friday, November 29, 2024, following so-called Trump-a-Rally.
The best Closing high was 20,272.04 ponts at those day and the best Intraday high was 20,332.50 points, also at the same day.
However unability to finish the year 2024 firmly above 20 000 round number, sharply pushed stock market bulls into fart and double-digit decline earlier in 2025.
The main chart indicates on major resistance again, near 20 000 point while technical indicator RSI (14) still goes sluggish.
Conclusion
The NYSE Composite Index's recovery has been closely tied to the ebb and flow of trade negotiations and tariff expectations. Positive developments in negotiations and reduced tariff threats have alleviated uncertainty, supported earnings expectations, and improved investor sentiment, all of which have contributed to the index's rebound.
--
Best wishes,
@PandorraResearch Team 😎
2025 forecast NYA Wave B top nearing 20% decline plusThe chart posted is that of the NYA .12/8 /2024 Major wave B top forming target 20,190 alt 22130 . Cycles are bearish into 2025 and well into oct 2026 Depression Like decline . into oct 2026 . First big decline should take us down into the spiral turn date 3/10 2025 week . in what should be an 11.8 to 16.6 % decline we should then see a rally into Mid July to Sept 2nd Then cycles begin next bear cycle phase . Down hard in most of 2026 The market in this decline should take us down about another 26 to 35% in wave 3 , The final low if the big picture is correct should see a major low oct 10/20 2026 the total decline should be 38% to 44 % Gold should see 1050 to 1489 . Bonds should form a rally but will fail over n over . BMV:US should see 119 to 121 handle in 2025 by mid oct 2025 . . Tariffs and the trade war are the main reason . But the markets since 2009 have been Liquidity driven with zero rates forced money flows into Assets 2025 will see a Deleveraging of inflation assets as we decline in housing markets based on the 18.8 year cycle in housing . Unemployment will see a sharp rise into 5.5 -6.1% into oct 2025 . based on downsizing of the federal workers Bitcoin will see a drop min 42/35 and a final low is 18500 to 22100 peak to low . . In dec 2021 Forecast called for a 20 plus decline into oct 10 to the 20th 2022 into 3510 to 3490 in the sp 500 .Dec 2022 forecast was calling for a rally to new highs in all indexes . In dec 2023 forecast called for the sp to reach 5636 to 5818 and the year of a vix of 29 or better we saw 60 . What next is at most I have said is a target in the sp of 6183/6235 We may or may not reach that But if is going to it will be jan 2 to the 20th 2025 . The last of the money flow . Best of trades WAVETIMER

NYA THE ONLY BULLISH WAVE COUNT 4th WAVE TRIANGLE on NEWSThe chart posted is that of the NYSE NYA this is the only Elliot wave Structure that is BULLISH I have now moved into calls in the SPY 540 and QQQ calls 450 dec 2026 . This is a HIGH RISK TRADE BUT I AM WILLING TO TAKE A 25 % position the sp cash was at 5415and qqq were at BEST at 452 put call above 1 and vix above 28.5 the fear greed was at 9 best of trades WAVETIMER

Multiple markets3.17.35 one of the oil companies is probably moving higher. coffee is probably moving higher. Futures oil is not clear to move a little higher or lower to decide on the direction. the Russell looks like it may be going higher.... there are a few other markets that are mentioned. gold is very bullish but I would expect gold to move lower but there's no trigger for that at this point. entering gold at this current price it's not the best kind of trade in my opinion. the video talks about gold at this price.

A review of the market1.16.25 I decided to talk about clutter and then need to keep the charts clean and accurate. it's important to take off lines that have no utility to you because that opportunity came and it went..... keep the chart from getting cluttered.... get rid of the lines that have no utility. I started with gold and I ended up with the NYSC composite which needs to start trading lower very soon or my thought that this move higher is more than just a correction. I talked about different strategies using the lines and the tools that we use but the actual Trading will be very different for some Traders versus others and yet the tools will work for a scalper as well as a Trader who wants to hold on longer.

NYA (XLV, XLF,XLE, DJT,IWM)It's been a while since I've covered Cyclicals.. since we are heading into earnings next week let's kick it off.
Monthly chart here on NYA looks like we've topped a 15yr wedge after the Trump election Squeeze..
Weekly chart is showing price is holding secondary trendline (Yellow). But it's stuck beneath weekly 20sma ...
q
Daily chart
As you can see we are trading between a rock and a hard place..
Holding trend but stuck under weekly 20sma.. either we break back above and push near Nov highs or the price breaks support and we start a major correction to monthly wedge support
Even if we correct back to monthly support I think it will be 1 more leg up here which would be an amazing spot to buy. To put that in perspective imagine rewinding time and buying at 2022 lows
XLF (Banks)
Similar to NYA top multi decade trendline.. If you gifted me Bank shares id sell them 😂.. when I look at this chart I understand Why Warren buffet sold his stake in BAC
Weekly chart
Sitting on trendline (Yellow) support with major resistance overhead... I don't think this gets back over 50.00 and I think a very rough Q1 and Q2 will be in-store for financials
Daily chart
You can see price here at trendline support.. you see that gap down there at 46.60? That was the Trump election gap ; that gap is my TGT for this earning cycle.. now if they pull the fawker route then they could pop this back up to 50.00 before the sell but if fade any pop on banks..
My correction TGT on the bank sector is 44-45..
XLV (Health)
Monthly chart Approaching 15 year trend support and Monthly 50sma.. stock has never closed below monthly 50 since 2009..
Weekly chart.
Similar analysis as monthly but insert 200sma instead. Riding lower BBAnds which usually leads to a rally back to upper bands also Stochastic oversold
Daily chart
I think we get a rally back to 148 or 200sma this earnings season..
Price action at 136 should hold and support this move.
I'd be very careful long at 148.. Price could form a right shoulder...
This incoming administration appointed RFK over health department and he's anti vaccination, Anti medication 😂.. RFK is part of the reason this sector corrected so hard so id be weary about leaps on any health stocks.. Don't get value trapped .
Energy Sector
XLE
Monthly chart..
In the last 20yrs we are at the top of a range
Technicals say the risk to reward trading energy isnt here at these levels
Weekly chart . Riding lower band and trendline so I expect a bounce back up 91.50 minimum here.
Daily chart..
You see the gap at 90.50?
Also 200sma right about at 91.00
Now take into account of the historical resistance at of 91.00 .. I think price has a very hard time at 91 and I'd bail on any longs near there
I'll do IWM and Dow Jones Trans later

NYSE Market Correction? Repeat 2022?Do you think 2025 could see similar price action like that of 2022?
Market seems to be hitting a key resistance level when looking at the weekly charts going back to around 2007-2008.
RSI seems to be at similar levels..

NYA one of the longest decline on record 11 days march 1929 Nya has two wave counts the Bullish one first we have just finished an ABC decline and w small new high will be seen over the next 6 to 11 Td . The bearish count is a simple one we would rally for 5 to 7 td and rally back to a .50 .618 .786 max in a clear ABC to mark wave 2 up

NYSE Advance - Decline line raises concerns as it standsChart pretty self explanatory. The NYSE A/D line has NOT confirmed the recent closing highs and a concern for more upside gains after the Trump rally.

MAJOR MULTI YEAR TOP FORMING NYA The chart posted is that of the NYA index .I have Not changed my Labeling or the Spirals . The Math is and has been rather Clear over the last 10 years and in fact going into the target low of 2009 march 9th . We have now entered the MIN target for wave C up or wave 3 of 5 of 5 at 19564 The targets call for this wave to peak 19564 to 20178 if wave 1 from covid low is to peak at .786 of wave 1 Jan 2 top 2022 .And wave C or 3 up at the same targets 19564/20178 The TURN due 10/10 to 19th saw the peak of 19901 and can be counted as 5 wave up .YET I can and have counted the rally as a abc x abc up which would mean we have One more rally above 19901 with it being at 20178 plus or minus 100 . .What if we had a blowoff ?? based on the Fractal of 2018 . That would mean a target of 22196 and wave 1 and 3 would be Equal. But in Diagonal waves tend to be .786 or .887 of the preceding wave Most of which have been .786 .This give me reason the believe we have a LAST GASP of EUPHORIA In the market just after the election into the 19th of the month ! .If we break the NYA 18,036 which is .786 market I would then confirm SUPER CYCLE TOP of wave 3 or Wave B Both are DARK Times Just ahead I ask you to see Gold chart and ask yourself IF things are so stable then Why would anyone be in Gold??? BEST OF TRADES THE WAVETIMER !! GOD BLESS THIS GREAT NATION !!!!

NYSE Composite Index New High!The NYSE Composite Index comprises around 2,800 companies. These companies span various sectors and industries, providing a broad view of the overall market.

NYSE Composite Index - New High! The NYSE Composite Index comprises around 2,800 companies. These companies span various sectors and industries, providing a broad view of the overall market.

NYSE Composite - Price Action Consolidated In A Triangle Pattern(1) The price was in an upward trend before reaching the 17,500 level.
(2) Following that, the price began to decrease, experiencing a drop of nearly 21%.
(3) After finding support near the 13,300 level, the price rose and broke through the neckline of the Inverted Head & Shoulder pattern.
(4) Subsequently, the price increased and is currently consolidating within a triangle pattern.
(5) If the price successfully breaks out, the potential resistance level will be around 19,650.

NYSE Stock IndexThis chart of the daily prices of the NYSE Index shows the secondary and tertiary stocks are up today in the face of a pull back in the broader S&P500 Index.

DJI/NYA afternoon analysisAn analysis for bears, as median lines of pitchforks seem unlikely to be tagged.
I like comparing the DJI and the NYSE; they both look similar in structure. The NYSA seems to have a "cleaner look" and (IMO) can likely be used to trade instruments going with and against the DJI.
The move off the October 2022 low, while impressive, looks corrective. Both the DJI and NYA obtained their ATHs on 20 May 2024. Unlike the NDX and SPX, neither have formed new highs since that time.
Both the DJI and NYA had what looks like impulse waves down from their ATHs, with corrective moves back up towards their ATHs.
The NYA has a triple combo down from January 2022 high to form an (a), a double combo (zigzag, green; regular flat, blue) up from October 2022 low to form a (b).
Bears now see the DJI and NYA looking for their primary (c) to complete the expanded flat starting in January 2022. Therefore, as long as 40077.40 holds as resistance for the DJI and 18421.9171 holds as resistance for the NYA, I'm looking for impulse waves down to complete the (c), with target bottoms below October 2022 lows.

NYSE Composite Index is at Support This daily price chart of the NYSE Composite Index is hovering above its support level after recently (May 15th) breaking out.

Technical Analysis Of NYSE Composite Index In Daily Timeframe
(1) After the breakout of the Rounding Bottom pattern, price has given a sharp upside rally and reached to its previous All Time High at near 18,340.
(2) After that, a sharp correction has been seen, which was quite natural. Price took support at near 17,380 level.
(3) Then with a strong up move, price made a fresh All Time High at near 18,400 level.
(4) 18,330 level will act as an immediate support level for the price and It is expected that the price will go up again from this level and achieve new highs.
(5) The overall sentiments will remain positive until the price is trading above the 17,380 level.

NYA, big pictureI think the NYSE Composite Index is very helpful in terms of showing where I think the major equity markets are, in terms of a five-wave cycle.
I have wave ((1)) ending in October 2007, wave ((2)) ending in March 2009 (Great Financial Crisis), wave ((3)) ending in January 2022 and wave ((4)) ending in October 2022.
I expected wave ((4)) to go deeper and get closer to the wave (4) of the lesser degree (COVID-19 bottom), but it did finish between the .236-.382 fib retracement drawn from wave ((3)) to wave ((2)), which is rather classic for a wave four.
The COVID-19 correction went below 10387.1680 (top of wave ((1)) ), so the COVID-19 of March 2020 can't be the wave ((4)) of higher degree.
I think the most likely count has us in wave 5 of (3) of ((5)), and that SPX, DJI, NDX, and RUT are all in the same place, setting up for a major top within the next 12-24 months.

The trendline provided a guide to stay in the market!This chart was posted on May 1st. 15 days later and the market hit new highs. The trendline was a successful guide to stay invested.
