$NYA #NYSE 1D (McClellan)Within a downtrend, I interpret this as a hidden bearish continuation divergence.
En medio de una tendencia bajista, interpreto que el oscilador de McClellan está mostrando una clara divergencia oculta de continuación bajista.
NYA trade ideas

DO NOT BE SHORT ANY INDEXES . I am net long 90% 90% net long option in calls still and 75 % net long the index across the board . most of my work and timing and models are in a place you DO NOT WANT TO BE SHORT AT ALL THE BLOW OFF WAVE 5

NYSE Showing loss of momentum in the weekly chartNYSE:NYA
There is a divergence shown in MACD and is showing a loss in momentum.
a possible future drop in price although we seam to have seen higher highs.
This does not mean a possible new swing to higher highs later on.
All my posts are not any kind of investment advice.

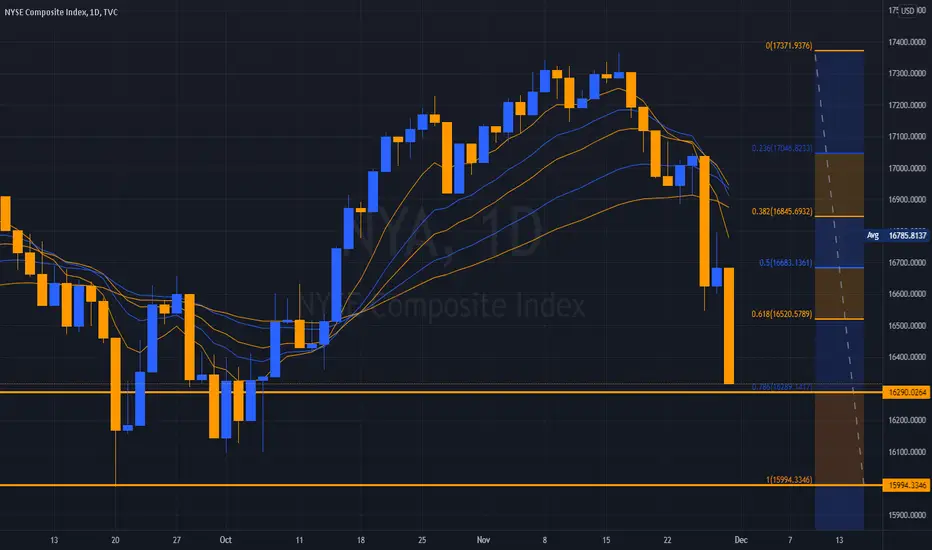
NYSE Stopped on a ton of Support Here's an overview of the NYSE exchange and some key reasons why we have a hard stop here. If we continue this downward pressure we will break all of these lines of support. All of the lines are on the chart are drawn, form support! There are alot more but these are the ones the mean the most. Smaller time frames under the daily indicate a Double bottom, but the weekly and daily are key and we are sitting on good support. Surely this bull run from COVID is coming to an end? The monthly indicates a very indecisive market right now, which is barely Bullish. If we expect anything like February 2021, we are in for a rocky month or so ahead.

NYA correction here's my take on TA for this stock.
I have no idea what this stock is, but just from volume and TA my thoughts are this will correct as shown.

NYSE Comp: Broadening Top Potential Macro WarningThe NYSE composite has spent the last year building a classic broadening top pattern. The pattern develops as strong hands distribute to weak hands, and when it occurs, often marks a transition from bull to bear.
1. Broadening formations are relatively rare and because the pattern itself is difficult to trade systematically (as the boundaries are continually moving farther apart) aren't given a lot of attention in literature.
a. Edwards and Magee in their seminal "Technical Analysis of Stock Trends" suggest that the broadening top, as a rule, only appears near the end or in the final phases of long bull markets.
b. Shabacker in his classic "Technical Analysis and Stock Market Profits" also remarks that the pattern is rare, but extremely important, often marking an important transition from bull to bear.
2. In my experience both Shabacker and Edwards and Magee are correct. They are rare and generally very hard to trade (so I don't bother) but they do offer an important warning of a potential phase transition.
3. Note that the pattern isn't always well defined, with overthrows and underthrows of the pattern boundaries occuring regularly. This is what makes it hard to trade or design a trading strategy around.
a. The pattern is extremely compelling when it appears in individual equity charts.
As I see it, these are the important chart elements.
1. The composite broke the trendline from the March 2020 low. This changed the weekly trend from up to neutral.
2. After breaking the trendline, the Comp spent most of the next year moving laterally and tracing out a clear broadening formation, warning of a potential phase transition.
3. Over the last few weeks the Comp violated the rising trend line (marked on the chart) along the last three internal trend line lows, and accelerated to the lower boundary of the pattern.
4. I have included the 10 and 40 week moving averages. The two averages are roughly equivalent to the 50 and 200 day averages. Note that the 10 has rolled over and is moving to meet the flattened out 50. Often a narrowing between two moving averages marks an important market decision point. Its interesting that it is occuring at the very moment when the broadening formation appears to be nearing a conclusion.
5. If the market does begin to breakdown there are several initial move targets that can be constructed. I like to look for confluences of move targets and chart supports. The more the merrier.
a. I like to overlay the .382, .500 and .618% retracement targets first.
b. Next I locate chart supports. In this case, the area around the 14183 high from early 2020 can be expected to generate at least some buying interest.
c. There is also a measured move target that can be generated using the width of the broadening top, it projects to roughly 14400.
d. 14089 is the .382% Fibonacci retracement.
6. The support confluence provided by the pivot, the Fibo and the measured move suggest an initial support zone between 14089 and 14400. I would clearly watch this roughly 2% wide zone for reversal behaviors to either reduce shorts or perhaps, if the right behaviors develop, consider new longs.
But again, the MAIN point is not so much generating trading targets as recognizing the pattern as potentially a harbinger of an important trend change. This is particularly important against the context presented in the macro overview posts of the last few weeks.
Good Trading:
Stewart Taylor, CMT
Chartered Market Technician
Shared content and posted charts are intended to be used for informational and educational purposes only. The CMT Association does not offer, and this information shall not be understood or construed as, financial advice or investment recommendations. The information provided is not a substitute for advice from an investment professional. The CMT Association does not accept liability for any financial loss or damage our audience may incur.

Entering the lost decade, then, perhaps, the golden age...'Twas a market full of bulls,
In a world of delusion,
Then came covid,
To super charge the illusion.
The Portnoy gamblers,
The Wall Street betters ,
The Tik Tok traders,
The gamma squeezers,
One by one they arrived
Dreamin' of the YOLO
Or quivering from the FOMO
Fueled by the FED
And their MMT!
Nobody gave a hoot about reality!
Been a while folks. Time to be careful again. Prolonged 90 year bull market might be finished. Most see exponential blast off in a new age bull market or final fifth wave explosion to come. I still hold that the rise since March 2020 is a fake MMT induced 'B' wave expanded flat with devastation 'C' wave to arrive shortly. If you've made your wealth, great job, and hold on to it like something precious. If not, shorting opportunity of a life time may be around the corner, although not for the faint of heart!

NYSE COMPOSITE - OuchThis Hot Mess is DOA.
Shattered, not merely broken.
An event that closely followed the ES / Value Line
correlation but with far more Gusto.
____________________________________________
The ONLY events that turn this are Monetary and Fiscal
Policy changes to encourage the Zombies to join.
Beyond that...
Adios.

5 wave up to a double top I have 2 counts I can see one is that this is wave one of a blow off .And second is a 5th wave to end the move not sure p/c in flat and all my model are at flat as well

NYAlook for volume and candlestick pattern ( engulfing ... pin bar ... inside bar ) on the support zone .
Please follow and like the idea for Support and More ideas like this and share your ideas and charts in Comments Section..!!
Thanks for Your Love :)

NYSE COMPOSITE - The Stick SaveBasic Materials, Consumer Cyclical, Financial Services, and Real Estate are the Primary Sectors
of the NYSE Composite.
We indicated the NYSE COMP was reaching an extreme A/D low and suggested a rotation would
likely provide lift.
It does not appear to be sustainable, but for now, it's in Trade.
______________________________________________________________________________________
Historically the Composite has followed Dow Theory Sell Signals. The Transports should be closely
observed at this time.
It will again as the lead up into Financial EPS arrives this coming week.
Inflation has been the Trade into all Primary Sectors with Real Estate beginning to show signs in
November of several issues.
The NYSE Composite is an index encompassing all common stock listed on the New York Stock Exchange,
including ADRs, REIT's and Tracking Stocks. It is the broadest measure of Market Health.
A free-floating market capitalization is a useful tool to "adjust" prices. It skews heavily depending
upon these adjustments to "Capitalization".
Financials, Energy, and Health Care are the Primaries by Market Cap.
_______________________________________________________________________________________
Traders should follow the NYSE closely as it provides a great deal of information with respect to the direction
of the Growth Sectors - The Trend sets the correlation, typically in a rising rate environment, we will see
a reversion to an Inverse Correlation.

TOP WAVE STRUCTURE THE BLOW OFF IS VERY WEAK WARNING 17770/18560 OVER the weekend I will post more in detail as to the nya targets and a wave structure in detail THE march low 2020 was perfect fib relationship to the 1974 low

NYA LOW DUE JAN 10 WEEK I need the nysi to get down to a from the 500 area to a minus 600 I have siad the avg drop in nysi if it fails at the 500 which it did should drop an avg of 1100 basis points . no change till that outside of C wave crash to which I THINK WE JUST STARTED SEE THE SP CHART POSTED THE ENDING OF WAVE B UP Look for a sharp C wave down. AND I think that will be wave A i.t. only BEST OF TRADES WAVETIMER

NYSE COMP - The MessThe Broadest Measure, it showing signs of the furthering Depression's expansion.
Independent Producers Dissolving.
Supply isn't needed when the large segment is slowly driven out of Business.
_____________________________________________________________________
It is that simple.

NYSE COMPOSITE - Enormous Range / Breadth - MentosBeginning to see signs of Coca-Cola meeting Mentos - YouTube it.
When the Mentos hit the Coke and the Cocaine remains Pure Bolivian
Fish Scale.... the results are explosive.
The Range here is extreme, Components on balance have been smoked
and hard.
Many Companies within it are Zombies Financially.
Smiley Virus knows and belts it out in convincing fashion:
www.youtube.com
Hannah Montana impresses from time to time, this is one of those moments.
________________________________________________________________
There is a large Break ahead, failures into Q1 are assured, many entities will
cease to exist in 2022.
Broken, Busted, Debt Laden - Walking Dead.
QE V.27 would need to expand exponentially to prop up this complete Mess.
Stimmy, FED balance Sheet and more Fiscal Dead Ends all needed to Ute Higher.
Possible, but the wreckage that would bring assure a Market Decline of 50%+ in 2022.
Where do you want to be then...
Ask yourself, who has the most to lose, the largest adjustment to make and will this
transpire in a Pacific fashion...
Highly Unlikely.

This is how I feel it is happeningI am a beginner in trading with modest experience so this is what I expect to happen in the New York Stock Exchange

TOP WAVE STRUCTURE FIB CYCLESAs you can see the LAWS of Nature Have been repeating very clear cycles . I see no GOVERNMENT OR BANKING SYSTEM too to be able to stop these cycles no more than a WAVE IN THE OCEAN from hitting the shore . it is just a law of nature that is all things be it TIME or markets. . .LIVE A SIMPLE LIFE IS MY WAY OF LIFE as I am grateful for my being a live . BEST OF TRADES WAVETIMER !!!!

TOP WAVE STRUCTURE FIB CYCLES FORCES The chart posted is that of the NYSE posted are every clear turning points as well as the pullbacks thru the last 50 years since we left a fixed amount of money end of BRETT WOODS. expansion of DEBT CYCLE But this cycles goes far beyond

NYSE COMPOSITE - Breadth remains UnwellAs we move into Year-End, the NYSE COMP should be Observed closely
as it has been the Leader along with the YM.
Any reversal here will be met with relief for the Big 7 - which continue
to grind higher with AAPL leading the rediculous charges higher.
______________________________________________________________
The FED is heavily intervening in the "7" it is all over the Tape... they are
supporting the narrowing Breadth.
The US Economy, what's left of it, is the Equities Markets.
They will defend it until they no longer do, we do not when, but all the
Indications are they will continue this absurd Prop until they fold up their
tent and let it fall under its own weight.
_______________________________________________________________
Patience as this can grind on for a while longer and they will make certain
to Run the Tables again and again prior to it being a locked-out downside trade.

NYSE COMPOne word - "Crashing"
While the Big 7 attempt to hold this Junk up...
The broad measure of Equity Health continues the spiral.
_________________________________________________
Only AAPL is in the Green ....
NYSE 2019 December - 2020 MarchNYSE COMP is far worse off Structurally @ NOW.
That said, let's see how far they will press their Luck.
I don't believe Consumer Sentient is going to IMPROVE
unless Uncle Sam opens up the Stimmy can o' Worms again
and barfs out $10,000 checks.
Odds do not favor that as we would have 3.5 10 Year Yields.
It is all on the Pelican at 3:05 PM EST.
I believe the Bird gets sold either today or tomorrow.
We shall see, without Risk, there is no reward.
The Trend, although confusing to the HERD...
Remains DOWN.
Unusual to be angry, but today... provides it in spades.
Not about getting even, simply disgusting.

NYSE COMPOSITE - Signals 15 - 20% CRASH AheadIt's comical, how the operators are so desperately trying to keep this JUNK
elevated.
They can game it during lower volumes, but they clearly do not have the
Support from anyone other than the FED to keep this MESS up here.
It is going to collapse under its own weight.
____________________________________________________________________
The FED now has one of two choices...
Go Lovie Howell - Rates SKY on the release of Pigeons
Accelerate Hawk - When Doves CRY
Swan Lake in Trade - Pick a Vector
Powell will be referred to as the "Pelican" moving forward.
_____________________________________________________________________
It doesn't matter - Equities are cooked SHort Term, Wall Street is getting their Fills
and they can be extreme.
We have our SELL Orders Positionjed again to 44% of Capital in TQQQ NQ RTY ES SMH
Momentum is to the Downside.
Every One of my larger TF indicators is as NEGATIVE as they have been in since 2020.
_____________________________________________________________________
A Larger SELLOFF it to be Anticipated - IMHO
Watch the ES @ 4665 - this is the Pivot to SELL for R/R up to 4707.
This would complete the Symmetry.
I am early on TQQQ SELLS but taking them today and intend to HOLD.
Full Position will be 20K presently 2K @ 170, 32 for SELL @ 171 up to prior Highs x 16
The same applies to NQ.
Tech will be the largest CORE SELL POSITION
______________________________________________________________________

NYSE COMPOSITE - 3/3 CompletesThe NYSE COMP has reached the lower-Price Objective.
A 3 Day Selloff concluded Friday during Expiry.
Will 3/3 of extend...
__________________________________________________
Advances 1,164
Declines 2,184
Unchanged 153
New highs 93
New lows 112
Adv. volume 243,470,747
Decl. volume 687,043,457
Total volume 937,893,669
__________________________________________________
Not a Sign of Health.
