NYA trade ideas


TREND CHANGE SPIRALS IN TIME FOCUS 9/20 TO 9/23 TOP 2019 THE PEAK IN TIME 2019 BASED ON SPIRALS AND FIB

Peak of bull market was 1/22/18On January 22nd 2018 the bull market peaked and we can expect that highs were put in. We have been sideways since as retail isn't sure what's going on yet. We are in a bear market we just don't know it yet.

NYSE Potentially Setting Up H&SThis pattern will delight and disappoint bears, as it leads to short term squeezes with long-term payoff. Would be hard to hold a short through this cycle, especially given the need to roll contracts beyond September.
Invalid if price dumps early, which it may.

makes the case for a bounce heremy gut doesnt agree with a bullish stance, but I follow the lines, not my gut. DISCIPLINE TRUMPS CONVICTION
NYSE medium-term target -35%Thanks for viewing.
I have talked about fundamental factors in previous posts that point in the same direction. This post is almost 100% from the chart.
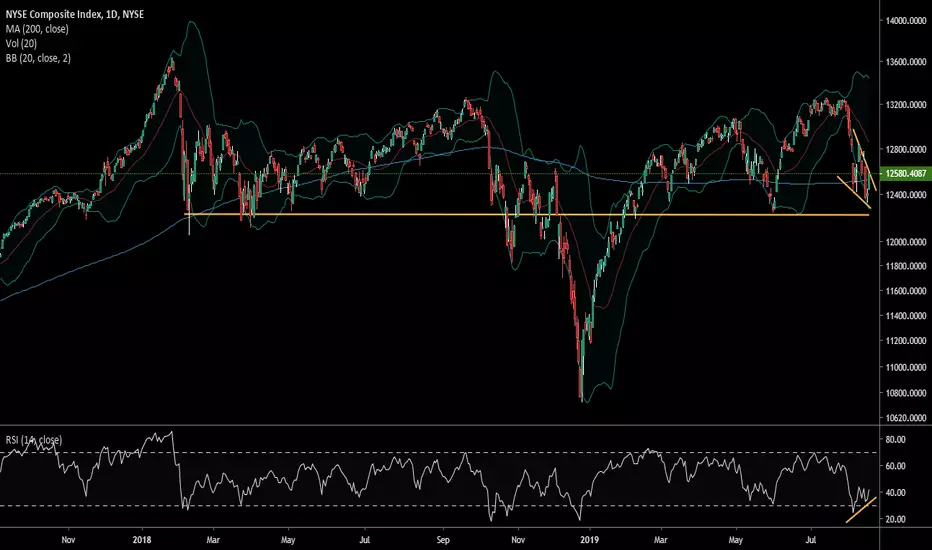
- The NYSE has been making a series of lower highs since January 2018 (The Dow and the S&P 500 are smaller samples of the market and have been making higher highs of late),
- Even the Swing high (which is well below the all-time high) of 13,261.770 set in Sept 2018 wasn't able to be broken last month,
- My target is a 1.618 extension of the price action between Sept 2018 and July 2019 which sits right around a key support level from April 2011,
- The one major fundamental factor (I am ignoring worsening of the trade war here) that happened since my last posts is that the Fed dropped rates 0.25% (taking interest rates back below the inflation rate - back to negative real interest rates) and the market reacted by selling-off. If you look into previous market cycles, the Fed normally dropped rates BEFORE the price drops started. This seems to be more of a key signal to the market that hard times are upon us, as opposed to the intended support of the markets. The monetary policy experiment of the past 10 years hasn't worked unfortunately. Expect interest rates to trend to zero - and possibly below while the world moves to save-haven assets.
My target is NYSE at or around 8500 level in the next 6 to 18 months. This isn't the end of the world, it is just the market heading for more reasonable valuations while the world deleverages significant debt levels.


NYSE Composite at Key Pivot PointThe NYSE, a laggard compared to $SPX, $NDAQ, et al, is just points away from printing a higher high (Sep/Oct high), but also bound to the peak of a potentially dangerous ascending wedge. Should a higher high be printed, this would be very bullish for the market in general. However, if it does indeed top here, it suggests a strong reversal is likely across all the major indices. Hardly a coincidence, given that next Wednesday's FOMC notes will reveal whether or not a July rate cut is coming. The market has currently priced in a 25bp rate cut in July. Pausing, or hiking would be incredibly bearish and probably spark a prompt sell off.

NYSE bear market short entry before DEEP correctionHi all,
Where we are right now:
1, Historically over-valued equity markets (average PE in excess of 30 in the SPX) / low dividend returns on equity (dividend yields approaching the return rate on Treasuries),
2. Volatility high and increasing (i.e. investors 2-4%pa dividend payouts can be wiped out in a day or two of bearish sentiment),
3. The market hasn't made a higher high in 17 months,
4. Global growth outlooks are being downgraded (New Zealand, Australia, China, and the USA and more just within the last few weeks and the IMF downgraded global growth outlooks for 2019 on the 9th of April),
5. Interest rates are set to drop again (it is becoming apparent Quantitative Easing monetary policy is a box that cannot be closed again),
6. There seems to be capital flight to safety - especially into USD treasuries and into the JPY,
7. Gold up 5% since the 22nd of May,
8. There are deeply concerning political signals being sent to the U.S. economy (and the world) by politicians who appear to be working AGAINST the best interests of the nation (despite what are probably good intentions).
9. Plus, if Douchebank goes under it may necessitate liquidation of 47 trillion in derivative contracts www.wsj.com
My original bearish position on the S&P500 was simply based on points 1 and 2. Despite everything else, these two points are sufficient to explain why this drop will be a big one. If all the gains (capital and dividend) from the past 2 years can be wiped out in a few days or a week, then the investors are clearly taking more risk vs the reward they are receiving (if they are in profit). Tiny dividends are okay as long as the share price continues upwards, but sideways or down just won't do the trick anymore. Most of the buying of the past 18 months seems to have been from buy-backs and leveraged traders. Most of the buying of the past 10 years can be traced directly to Quantitative Easing monetary policy - cheap cash looking for a place to go. There is a chance that the experimental remedy for the 2009 crisis removed the symptoms temporarily while the underlying illness progressed.
I don't want to mention Elliot Wave, as so many people write it off, but EW points to the maturing of a very long-term cycle - I see the bull-run post 2009 as being the final impulse wave up before a correction. Lets ignore EW, but the past 10 years has seen the weakest economic expansion in history parallel with a very strong bull-run in the NYSE / SPX / DOW, is it more reflective of central bank monetary policy instead of real growth? www.bigtrends.com
Oh well, that's enough. Good luck everyone. You might read the above as in a completely different way - and remain bullish. I just can't see how right now. All I see from todays bullishness is a place to note the end of wave (1) down. Next should be a lower high.


wave 3 up in a major buy panic is just starting My alt wave structure in the nyse has come to be for wave c of 2 down i now see a major buying panic to just start .We could ven pull back to a near perfect .382 down in the nyse and my model for timing may 2 top as was the dec price targets are set for buying panic I am net long 150 plus 35 % in calls and see nothing to stop this next wave up

WAVE 3 UP IS JUST STARTED TARGET MIN 13630 Well my alt that wave for wave c has been seen if you follow my timing and work you are fully net long and with margin wave 3 up is started the blowoff is just about to start we pulled back to a near perfect .382 in the nyse and more are bearish now than the low of dec into my target we are about to see a panic in buying from now till mid july and into sept 3

wave 2 of 5 blow off is ending now will post in more detail later today But I have just added to net long 15 % more


THREE PEAKS AND A DOOMED HOUSE STILL MORE UPSIDEIT IS SIMPLE MARKET TOPS ON GOOD NEWS AND BOTTOMS ON BAD FYI IN APRIL I WAS VERY CLEAR TOP 4/26 TO MAY 10 FOCUS MAY 2 AND TARGET 2953 TO 3011 PEAK MAY 1 2954 .I ALSO WAS VERY CLEAR WE WOULD DROP TO A .382 PULL BACK WE ARE NOW HERE I AM NET LONG 150 % AND NOW LONG CALLS AT 35 % AS WELL TOP IS GOING TO BE AT OR ABOVE 3011 AND WE ARE IN POINT 22 IN MY 1987 MODEL

WAVE A OF 2 OR WAVE 2 DOWN IS NOW ENDINGWE ARE NOW ENDING WAVE A OF 2 OR WAVE 2 WAVE 3 TO THE UPSIDE IS JUST AHEAD DO NOT BE SHORT AS MY 4 SPIRALS TOP PHASE APR 26 TO MAY 12 FOCUS MAY 2 AND THE PANIC CYCLES HAVE NOW REACHED THE CYCLE LOW UPSIDE FOR WAVE B WOULD BE 3010 ABOVE 3010 WOULD TARGET 3081 TO 3155 I AM 120% NET LONG

NYSE in a bear market for past 16 monthsThe NYSE is the biggest and most liquid equity market in the world. It has been highly volatile since the start of 2018 and has been making lower highs and lower lows since Jan 2018. Yet there is still talk on the ongoing equity bull market in the US. From all time high in Jan 2018 to the brief low in December 2018 the drop was over 20%, meaning we are technically in a bear market.
www.multpl.com (not for the NYSE index but a reasonable proxy) shows that the S&P 500 currently sits at 31.05 average PE ratio as at May the 3rd. A valuation of 31 times earnings is very high and has historically proved to be unsustainable. The earnings are diluted too much and dividend returns of 2-4% become common (unless the Company juices the dividend returns with borrowed money or increases share buy-backs), which is okay when the equity price is rising... but when it is volatile or dropping the calculus changes. Investors realise that the risk adjusted returns are too low and will seek lower but safer returns, or higher returns elsewhere (possibly in growing emerging markets). This situation will result in profit-taking (as is happening). On the way down, I expect average PE ratios to blow through a fair 15:1 level and go below (the bottom of my blue box is where (if earnings remain stable) PE ratios will equal roughly 15:1. Waves (1) through (5) appear to form the 5th wave of a much larger multi-decade move (not charted due to space).
Hopefully, I have charted a plausible scenario. If you use the Elliot Wave principle in practice you would look for:
- wave (2) to retrace not below the start of wave (1) which is the case,
- wave (2) to retrace more than wave (4); wave (2) retraced 50% while wave (4) retraced more than 38% but less than 50% (its just a guideline - but a useful guideline),
- wave (3) to generally be the longest wave (often the longest nut never the shortest) and to normally exceed a 1:1 extension of wave (1) - which is the case,
- wave (4) should not enter into the wave (1) territory (some exceptions exist) - which is the case,
- and wave (5) to normally end around the 1.618 extension of wave (1) which is ALMOST EXACTLY the case.
- This will precede an ABC correction that retraces a significant portion of the previous move (which seems to be unfolding).
- The past 9 years of the NYSE is a textbook example of an impulse wave - the only thing missing would be for wave (3) to be a bit steeper / faster moving price move. Sometimes it is hard to arrive at a wave count, but not in this case. Sometimes waves extend, but seemingly not in this case.
Fundamental justifications for my bearish view include corporate debt loads, volatility, risk adjusted return, downward revision in global growth prospects, money managers reducing exposure to equities, and my views on the manipulation of interest rates and currency supply by the fed among other factors.
I have already added significantly to my margin via successful short trades last week and will be looking to re-enter short once a lower high has formed. The hard part will be holding on.
Just one last comment (if this wasn't already long enough); I don't revel in my bearish view. If I (and a lot of other people) am right this will mean employment and investment losses and everything negative that is associated with that. All I am trying to do is to protect myself and my family.
Thanks for viewing and protect those funds.


NYSE almost collapse soon !!!NYSE is almost time that go all time high and collapsing soon
i think the pattern probably look something similar to this
it probably finish in 4th up because most likely it is delay
if you like my analysis and signal please help to like and follow
Thank you very much

Part Time Sentimental indikator,Extrapolating that the copoc curve does turn uo and that the market is still feeling positve but not yet estatic... we could be heading for the blow off ,,, the market will start looking toppy in November...

