[O] - Weekly - ShortPotentially might see price find small amounts of support at the bottom of the weekly FVG / BISI - as price completes a rebalance of an imbalance. Lines up with the 75% fib retrace.
Fallback would be the volume imbalance resting just below the FVG.
Seeing how price reacts at the FVG and or VI would be key as to whether we see strong or weak level of support for a potential upside retracement.
However, price action remains very heavy with no up-close candle insight in previous 7/8 weeks. No clear and obvious upside objectives or draws on liquidity (other than a small VI).
Whereas, there are multiple discount PD arrays outlined, which are likely the root cause of heavy downside draw on liquidity.
1st target - previous large downside leg's low - $55.50
2nd/3rd target - RELs outline at $55.28 and $54.54
4th deeper target - high of weekly liquidity VOID - $52.45
Do you agree? Have I missed something?
Let me know of your thoughts.
O trade ideas

O for the winReal estate is not the same as it was a year ago, I like O for 2023 and look to make some gains going into Q1. LONG

$O with a Bullish outlook following its earnings #Stocks The PEAD projected a Bullish outlook for $O after a Positive over reaction following its earnings release placing the stock in drift B with an expected accuracy of 75%.
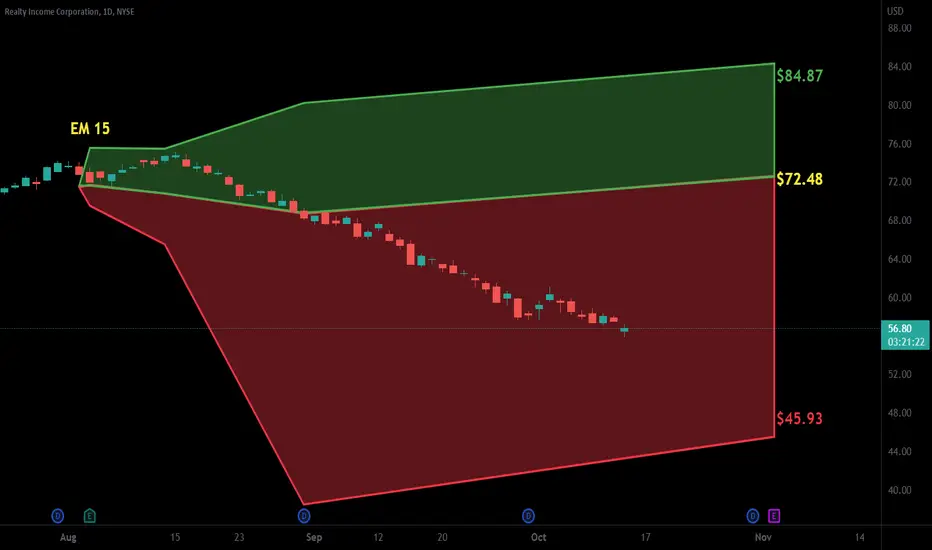
Realty Income Corp Set To Move Up Prior To Inflation ReportBased on historical movement, the trough could occur anywhere in the larger red box. The final targets are in the green boxes. The pending top should occur within the larger green box as has been the historical case. Half of all movement has ended in the smaller green box. In this instance, the signal indicated BUY on September 23, 2022 with a closing price of 61.81.
If this instance is successful, that means the stock should rise to at least 63.129999999999995 which is the bottom of the larger green box. Three-quarters of all successful signals have the stock rise 4.728% from the signal closing price. This percentage is the bottom of the smaller green box. Half of all successful signals have the stock rise 6.7065% which is the end point of the black dotted arrow. One-quarter of all successful signals have the stock rise 8.6685% from the signal closing price which is the top of the smaller green box. The maximum rise on record would see a move to the top of the larger green box. These are the same concepts for the levels in the red boxes as well.
The ends/vertical sides of the boxes are determined in a similar fashion. The peak of the rise can occur as soon as the next trading bar after signal close, while the max rise occurs within the limit of study at 35 trading bars after the signal. A 1% rise must occur over the next 35 trading bars in order to be considered a success. Three-quarters of successful movement occur after at least 15.5 trading bars; half occur within 28.0 trading bars, and one-quarter require at least 33.5 trading bars.
The black dotted arrow represents median historical movement. Medians are a good metric, but they are just one of many I use when forecasting future movement.
As always, the stock could decline the very next bar after the signal without looking back (therefore the red boxes would not come into play) or the stock may never decline (and the green boxes may never come into play).

O - Strong Uptrend ContinuationAn example of a very strong uptrend
The only breaks of the trend were quickly recovered

$O with a Neutral outlook following its earnings #Stocks The PEAD projected a Neutral outlook for $O after a Positive over reaction following its earnings release placing the stock in drift D with an expected accuracy of 42.86%.


Realty Income: Uh O 💪🐻It's hard to find a dividend portfolio that doesn't contain Realty Income in it. Chunky 4.2% dividend + monthly dividends instead of quarterly.
Technicals paint a less rosy picture. On the monthly timeframe, price wicked up to the top of the bollinger band & .886 fib, got rejected, and formed a gravestone doji. Weekly time frame already shows the continuation of a shooting star pattern. Target is $34-$36.

O presenting a BUY LEVEL NYSE:O
The Conservative Stop offers less exposition and a great Risk/Reward Ratio of 7 at the risk of being too tight .While the wide stop offers much more room for the trade at the expense of a lesser Risk/Reward Ratio approximating 3 .
Whatever your style ,trading is a game of probabilities and the bulk of the profit if not all the significant profit is realised on a long serie of trades and not solely on a single trade . Results of any Individual trade shrink to insignificance when compared to the sum total of the long serie of trades . At the same time it is important to stick each time to your edge on the market in order to profit on the long term .
Enthusiastically Brought to You by ManhattanStocks
All Requests Suggestions and Remarks are Welcome

Realty Income $O Looking ready to go.Weekly chart with a large downtrend getting ready to break out on $O. MACD has crossed and all VWAPs and EMA cloud are supporting price. Only a matter of time. in my opinion

I dont think it breaks resistance! 🔴O at extreme resistance, most likely heads lower from here. my targets are 68.02-65.53

O (Realty Income Corporation) - Bearish Multiple Top - DailyO (Realty Income Corporation) stock price has reached a two-year, all-time-high resistance zone of $72.56.
If resistance holds strong, the stock price could pullback over time to test support below.
O (realty income corporation) reports earnings on 05/04/2022.
Entry (short): $71.56
Profit Target +4% (exit): $68.59
Stop Loss -2% (exit): $72.91
Utilize stop loss, position sizing, risk management.
Note: XLRE real estate ETF has also begun to pullback on a daily chart.
All content is Not financial advice. Trade at your own risk.

4/10/22 ORealty Income Corporation ( NYSE:O )
Sector: Finance (Real Estate Investment Trusts)
Market Capitalization: 43.145B
Current Price: $72.16
Breakout price (hold above): $72.45
Buy Zone (Top/Bottom Range): $70.90-$69.20
Price Target: $76.80-$77.90
Estimated Duration to Target: 76-80d
Contract of Interest: $O 6/17/22 72.5c
Trade price as of publish date: $2.15/contract

Realty Income Corp (O): Looking for a Pullback Below 50% FibO has been slowly grinding higher since March 2020 lows topping out at $72.55. Price action since November has been stuck in a range with the January 2022 price action sweeping above the double top highs at $70.40 level. After the sweep higher, price action appears heavy at current pricing especially since the asset has not made any meaningful retracement lower. Currently I am bearish on O with downside objectives being 65.60, 62.50 and 54.50 levels.

$OHead and shoulders breaking down. Further downside coming.
CHART LEGEND:
white dashed lines = bull/bear takeovers
blue lines = call targets
yellow lines = put targets
red line = danger zone
orange lines = trend lines
green lines = safe zone
any other lines add will be discussed with the ticker
NYSE:O

Order Block Finder + Moon PhasesCombined Order Block Finder indicator with plus Moon Phases indicator

REALTY INCOME CORP (O): Consolidation.Consolidation has been broken upwards with the minimum target level in the area of 75.20.

O analysisI like this as a buy, but wouldn't be surprised at all if it came back to retest 66.5. Might be worth the wait.

Weekly Forecast 13th July 2021 I haven't made consistent posts for quite a while and that is due to the time constrain that I've suffered as a university student. So I've mostly only had time to analyze and make trades myself; neglecting the public posts and forecasts. Anyways, as always I am still bullish on O, It has always been a solid performer in my long-term portfolio. In one of my previous posts, it appears that my forecast was somewhat correct, more than I initially predicted and the stock now sees itself trading in an upward range. Even with the share issue that occurred previously the stock's price still remains strong and shows promise that bullish progress will continue to be made in the near future.
Anyways, what I can observe in the price action is mostly bullish. The following will be some general information about my analysis. The depth of the analysis will depend on the time I have available:
On the weekly graph, we can see that the general trend has been slowly creeping upward rather consistently which makes me happy as I would like to add into my long-term portfolio weekly.
Zooming into the daily graph we are provided some more meaningful information to create a forecast, allowing me to draw some trendlines that resemble a ascending channel; although this can generally be seen as a bearish pattern we must ultimately wait for more information before we can confirm anything. There isn't really much to comment on the price action as all the indicators and analysis generally point toward gradual movement to the upside.
Forecast:
In my most optimistic case I can expect price to rise to about the 72-73 dollar mark testing the resistance barrier where it can either be rejected and make a short term drop to the support at roughly 68. From there we will require more information before saying anything.
As for my more neutral case, price might not even reach the top of the channel and could drop right down to the support after hitting 69.
Anyways, that is what I've forecast for this stock. Take it with a grain of salt and note, that none of this is financial advice so do your down research. Happy trading.

Investment in Reality Income could be greatO want to grow in a booming market of real estate: finance.yahoo.com
This should move the stock up a lot, even more stocks will come in the markets.
See below a new report on housing market predictions: www.noradarealestate.com
So a lot of bullish signes for a investment in O, even it is a reit... It's now a growing reit with new investments.

Reality could be a buy in the next two weeksPrices could go down possible to get a cheap entry price. Real Estate should be Long in mid range.

There is no reason, why this REIT should go to old highsReits shouldn't be affected negativly (but mostly positv) by inflation. There is no reason,why this stock should be valued that low, right now as economy starts, it should go back to old profits in the next half year or so.
I will try to get in a invest, when the next drawdown may come.
