OGE: Bull-run continues.Another decent stock. Weekly it's been going up with some strong volumes and daily it's staying within it's channel and might even break out for a more parabolic movement. Daily volume is not very impressive though. I would wait for next week to see if it's going to retrace beck to touch the lower boundary of its trend. It might break out of the upper boundary too. In that case, we need to wait for it to come back into the channel or test it once and confirm the parabolic move with a green candle afterward. Keep it on your watchlist.
OGE trade ideas


BUY to OGE ENERGY CORPHey traders, OGE ENERGY CORP is in a fake bearish configuration with a large trading volume and a failed sellers attempt. Looking at the TIMEFRAME M1 we see a panicking marubozu with an unusual volume of wind. It goes on its last low point to make a big reversal possibility of breakout the price. At the same time, the VWAP broke the strong resistance and finally started testing the top of the consolidation zone.
We can breakout with the current buying force to arrive in a second and start on the next higher. Who is in a bearish breakout gap one may have to make an attempt to close a bearish breakout gap. On a major resistance by going back in time then managing to want to test the consolidation zone.
Please LIKE & FOLLOW, thank you!
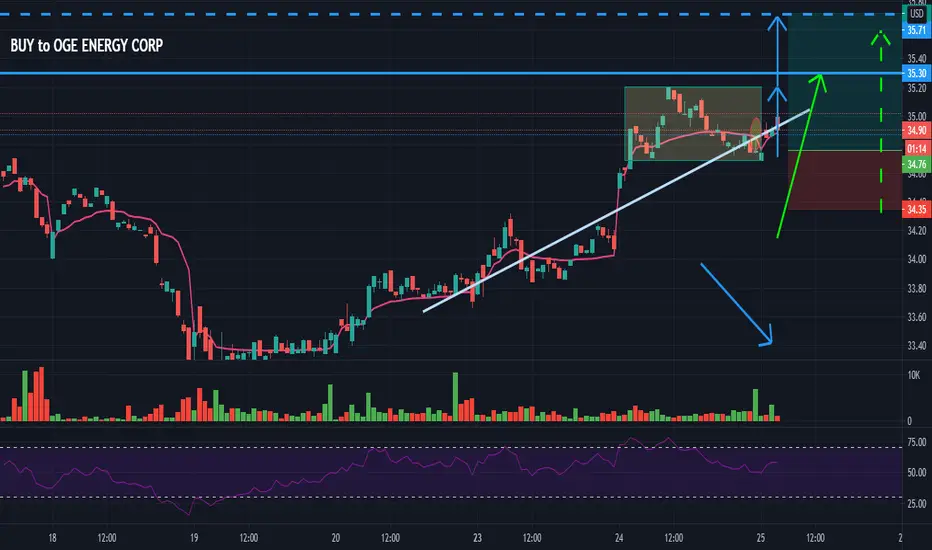
OGE ENERGY CORP Idea DailyHey my friends, OGE ENERGY CORP is a fake bearish move with a shadow of sellers and a high volume of buying traded. In the TIMEFRAME M1 we see an upside down hammer candle bull with a volume explosion that goes towards its last lowest. Then make a big reversal, the propability of breaking the price at the same time breaking a comfort zone to get to its next higher. The middle median may be forcefully broken after seeing if the buyers are still in the game to close the bearish breakout gap.
Please LIKE & FOLLOW, thank you!

$OGE can fall today after bad earningsEarnings intraday trading strategy signal.
OGE Energy Corp. provides energy and energy services primarily in the south-central United States.
The company has been beating EPS estimates for 4 of 5 quarters (Q3 18, Q4 18, Q1 19, Q2 19, Q2 19, Q3 19). But yesterday the earnings report has a very negative surprise — www.benzinga.com
I suppose many traders will close their long positions today due to bad earnings report and downside market trend.
So I hypothesize that $OGE price will be falling from the market open to market close.
Due to strategy, the short sell can be from the market open price,
stop-loss — $0,94 per share,
take-profit — market close price.
Do not view this idea as a recommendation for trading or investing. It is published only to introduce my own vision.
Always do your own analysis before making deals. When you use any materials, do not rely on blind trust.
You should remember that isolated deals do not give systematic profit, so trade/invest using a developed strategy.
If you like my content, you can subscribe to the news and receive my fresh ideas.
Thanks for being with me!

OGE is a buy after today's wrong-way earnings moveOGE today reported earnings of $1.25 per share, up from $1.02 the same quarter last year and beating the consensus estimate of $1.10. Revenue was $739.2 million, up from $$684.5 million last year and beating the $728.2 million estimate. The company boosted full-year guidance to $2.24 to $2.30 per share, up from its previous guidance of $2.05 to $2.20 per share and above the consensus estimate of $2.13 per share.
OGE has fallen today despite the great news, which presents an opportunity to buy. OGE is a growing company with a solid dividend yield of 3.5%.
I think the reason for the stock's drop is that OGE's guidance section is a bit confusing. OGE is a holding company with a number of subsidiaries, including a utility called OG&E. The guidance section of the earnings report reads,
"The Company's 2019 OG&E earnings guidance is projected to be between $1.74 and $1.78 per average diluted share. This is an increase from the previously issued guidance between $1.55 and $1.62 per average diluted share. . . . OGE Energy consolidated earnings guidance projection for 2019 has increased to between $2.24 and $2.30 per average diluted share. This is an increase from the previously issued guidance of between $2.05 and $2.20 per average diluted share and is primarily due to higher projected earnings at the utility."
So you can imagine that if you read the report and compared that first guidance range with analyst estimates, it would look way lower than the estimates. Investors who play earnings don't always read the reports very carefully, because they're trying to react quickly. That may have led them to jump the wrong way if they read only the first sentence of the guidance paragraph and confused OG&E's guidance with OGE's. These sorts of errors happen in the market sometimes, and it presents an opportunity for the more careful investor.


OGE - hey good lookingAnother nugget in a down day for the DOW, beautiful retracement with solid earnings to boot :)

OGE, you beauty.On a difficult day to pick stocks, managed to find this nugget of gold. Perfect retracement, daily's good. Arrow is at point of entry (I use 5 min charts but can't publish that timeframe :( )

OGE Corp ( Short Mid Term )Hi, Price has touched strong level and there was also a strong pivot which is a good sign to reject price for the mid-term position. wait to see good rejection candles
Good luck!
Happy Pips! :)

#OGE #stock #long
On the daily OGE formed an inverse H&S. all three indicators look like they are heading higher. with a little over 2 RRR it looks like a good play to try. It also has options.
weekly
stoch rsi and obv leading the way up. MACD looks to be crossing up.
monthly
MACD and stoch rsi leaning down. OBV neutral

OGE Short Trading Plan Update: Close All Short PositionsHi all,
This will be the last update to the Short OGE Trading Plan, as the breakout move is over and hence the Trading Plan is completed.
Here's why>
Update as of 29 July 2015:
Between 23 July to 24 July, Market has briefly traded below the theoretical price target of 28.00.
After which price rebounded sharply to trade at around 29.00 now.
I believe the main reason is that there are traders who planned to take profit on the theoretical Double Top price target, therefore the sharp rebound is likely due to profit taking.
Therefore, the recent price action is no longer a breakout move.
Hence for those who have followed the plan and are still holding short position, it is now time to recognize that the likelihood for more profits in the near term is small and all short positions should be closed.
After all, capturing a 9% short move, in less than 40 trading days is definitely not a bad result at all.
This concludes the OGE Short Trading plan and I will look to write a new one, after markets has priced in the FOMC Statement later today.
Like it, Share it, Follow it~
Trading View: BreakOutArtist
StockTwits: stocktwits.com/BreakOutArtist

OGE Short Trading Plan Update: Time to Take ProfitHi all,
This is an update to the Short OGE Trading Plan, which is about Trading a Double Top Pullback.
Update as of 29 June 2015:
Market has plunged sharply down from $31.20 in the last update to as low as 28.65 on 25 June, and currently hovering at $28.80s.
At this point, the bears have used up much bearish momentum pushing the price to $28.65 and we are see signs of support/ profit taking from the short positions.
For those familiar with Elliott wave, you can recognize that price is likely to try for one more short push towards $28.00.
To re-phrease, yes there is still a bit of momentum for price to try trading towards $28.00.
However, during this attempt it is reasonable to see profit taking and support buying going against this last push down to $28.00.
Hence, we are likely to see choppy trading while price drifts lower in the overall bearish environment.
Taking Profit:
For those who have stuck with the plan and took profit at around $29.00, especially during on 25 June, I congratulate you for following the plan and a trade well done.
For those who have yet to take profit, now might be a good time to take your profits, at the very least closing part of your position out at current price levels.
Given, that a huge bearish momentum has been spent driving prices down from $31.20 to $28.00, it will be rational to close out at the very least 60% of your short position and leave the rest to run.
After all, what's not to like in locking down a 9% Spot Price movement?
Sitting Tight and Leaving a Bit of Money on the Table:
For those who still want to stay short and ride the push towards $28.00, please be mentally prepared to withstand choppy price movements.
Reason being>
a) There is lesser bearish momentum now, therefore there are now lesser traders willing to add short positions and put in selling pressure to the price.
b) Profit taking (buying) is very reasonable to come into play at this levels, creating support for the price.
The closer the price gets towards $28.00 the more likelihood of buying support to come in.
Risk:
By now the risk of the trade becoming a loss is very remote.
At this stage it is a matter of how profitable the market allows you to be and your personal decision when to close out.
At least setting a Stop Limit at $30.00 will be reasonable if you intend to keep your short positions open.
References:
Double Top: stockcharts.com
How to Short a Stock in Double Top Pattern Strategy: www.simple-stock-trading.com
Using Support and Resistance Levels of Relative Strength Index> Technical Analysis for the Trading Professional by Constance Brown, Chapter 1: Oscillators Do Not Travel between 0 and 100.
Like it, Share it, Follow it~
Trading View: BreakOutArtist
StockTwits: stocktwits.com/BreakOutArtist

$OGE Short Update: Stop Loss at Break Even and Sit Tight!Hi all,
This is an update to the Short OGE Trading Plan, which is about Trading a Double Top Pullback.
Update:
Market has broken out below support level of 31.15 and closed on 02 June 2015 at 30.55.
Since price has decided to break out below, the bearish momentum should carry price lower towards the profit target of 29.00.
Shifting of Stop Loss to Break Even level:
For those who have entered short slightly below $32.00 and are still short, your position should be profitable on paper.
Now we can consider shifting the stop loss to break even level.
The reason is that since prices have already moved well in your favor, therefore shifting the stop loss to break even will effectively minimize the risk of this trade resulting in a loss.
In other words you are turning this trade into a position where it is close to impossible to lose.
It is very much a cardinal sin for a trader to allow a well winning position to become a loss.
Stick to the Plan and Hold your Horses:
It is tempting to take profit now. However if we shift the stop loss to break even, we can really sit on this position and let the market work it's move.
To Quote Jesse Livermore> "Traders] who can both be right and sit tight are uncommon. I found it one of the hardest things to learn. But it is only after a stock operator has firmly grasped this that he can make the big money.”
Taking Profit: $29.00
While the theoretical Double Top target is $28, it is better to use a more conservative target of $29.00.
Advanced traders may also look to take profit when RSI (14) is close to reaching the 28.0000 level.
Risk:
The is a risk that this is a fake continuation move. If a fake move occur we can consider flipping around, covered in the next point.
Flipping Around if Short Squeezed:
In the event that price manages to trade back above the neckline of $33.00, it will mean that the Double Top pattern has failed and the short position will incur a loss.
It is also likely that this failed pattern will lead to a short squeeze move with enough momentum to push prices higher to around $35.50.
Therefore more advanced traders may consider turning around and go long above $33.00 to capture this short squeeze momentum.
References:
Quote on Sitting Tight: Reminiscences of a Stock Operator by Edwin Lefèvre
Double Top: stockcharts.com
How to Short a Stock in Double Top Pattern Strategy: www.simple-stock-trading.com
Using Support and Resistance Levels of Relative Strength Index> Technical Analysis for the Trading Professional by Constance Brown, Chapter 1: Oscillators Do Not Travel between 0 and 100.
Like it, Share it, Follow it~
Trading View: BreakOutArtist
StockTwits: stocktwits.com/BreakOutArtist

$OGE Bearish Trading Plan can now be Executed.Hi all,
This is an update to the Short OGE Trading Plan, which is about Trading a Double Top Pullback.
The Earnings Release on 7 May 2015 showed better than expected results.
This has driven price to open higher at 32.23, reaching as high as 32.38 before closing the day at a loss for $31.96.
This price action shows that the Earnings Release has failed to convince the market to take the long side, leaving the downside as the more likely direction for the Stock Price.
Therefore Short Entry Condition has been met and a Short Trade can be executed for $OGE
Short Entry Conditions:
Only when both conditions a) AND b) listed below are true:
a) If price is does not do a daily close above $33.00 from now.
b) Price can convincingly close a day below $32.00.
Initial Stop Loss: Above $33.00
The reason for this trade is to capture the bearish trend from a Double Top pattern.
Therefore, if price manages to trade above $33.00, it means that the Double Top pattern has failed and the reason to maintain a short position is eliminated.
Shifting of Stop Loss after entry:
If prices manages to trade to $31.50 after entry, we can consider shifting the stop loss lower to $32.00.
The reason is that if price is genuinely breaking out below, it should exhibit a clean strong move downwards $30.00 and below.
Therefore this shifting of stop loss is a conservative approach to protect risk capital.
Taking Profit: $29.00
While the theoretical Double Top target is $28, it is better to use a more conservative target of $29.00.
Advanced traders can also look to take profit when RSI (14) is close to reaching the 28.0000 level.
Risk:
The is a risk that this is a fake continuation move. If a fake move occur we can consider flipping around, covered in the next point.
Flipping Around if Short Squeezed:
In the event that price manages to trade back above the neckline of $33.00, it will mean that the Double Top pattern has failed and the short position will incur a loss.
It is also likely that this failed pattern will lead to a short squeeze move with enough momentum to push prices higher to around $35.50.
Therefore more advanced traders may consider turning around and go long above $33.00 to capture this short squeeze momentum.
References:
Double Top: stockcharts.com
How to Short a Stock in Double Top Pattern Strategy: www.simple-stock-trading.com
Using Support and Resistance Levels of Relative Strength Index> Technical Analysis for the Trading Professional by Constance Brown, Chapter 1: Oscillators Do Not Travel between 0 and 100.
Like it, Share it, Follow it~
Trading View: BreakOutArtist
StockTwits: stocktwits.com/BreakOutArtist

Trading Plan for Bearish OGE Double Top PatternHi all,
Here is a Plan which is about Trading a Double Top Pullback.
In trend reversal chart patterns, after the initial breakout move, there is a tendency for price to retrace towards the breakout line, before continuing the trend reversal move.
This setup provides a good entry as the Stop loss level is clear and tend to have a low probability of losing, if the position is well managed.
1. Price for OGE has been trading in a general uptrend from 2011, with price trading from $20.00s to around $38.00 on 2013 November.
2. While the trend was generally bullish, there were signs that price was shifting to sideways consolidation, when price was ranging between $38 and $33 between 2013 June and Jan 2015.
The sideways consolidation was confirmed when the uptrend line in 1. was broken in 2014 August.
Subsequently, we observed a Double Top pattern being confirmed, when price broke below significant price support level of $33.00 and drop to around $31.30s.
Yes, this Double Top formation does look a bit fuzzy, but if you switch to the Weekly or Monthly Charts, the pattern will be clearer.
This Double top has a neckline of 33.00, with an estimated height of $5 (38.00 - 33.00) and a theoretical price target of $28.00
3. From March 2015 until now, we see that price has pullback to neckline ($33) and there were signs of resistance selling.
This price action indicates that it is likely that short positions are being entered just below $33.00, in anticipation of further bearish price move.
Projection: We project that additional resistance selling will likely come in to bring prices much lower and continue the bearish trend established by the Double Top pattern in 2.
Short Entry Conditions:
Only when both conditions a) AND b) listed below are true:
a) If price is does not do a daily close above $33.00 from now.
b) Price can convincingly close a day below $32.00.
Initial Stop Loss: Above $33.00
The reason for this trade is to capture the bearish trend from a Double Top pattern.
Therefore, if price manages to trade above $33.00, it means that the Double Top pattern has failed and the reason to maintain a short position is eliminated.
Shifting of Stop Loss after entry:
If prices manages to trade to $31.50 after entry, we can consider shifting the stop loss lower to $32.00.
The reason is that if price is genuinely breaking out below, it should exhibit a clean strong move downwards $30.00 and below.
Therefore this shifting of stop loss is a conservative approach to protect risk capital.
Taking Profit: $29.00
While the theoretical Double Top target is $28, it is better to use a more conservative target of $29.00.
Advanced traders can also look to take profit when RSI (14) is close to reaching the 28.0000 level.
Risk:
There is a risk that Earnings Release on May 07 2015 will drive prices higher.
Flipping Around if Short Squeezed:
In the event that price manages to trade back above the neckline of $33.00, it will mean that the Double Top pattern has failed and the short position will incur a loss.
It is also likely that this failed pattern will lead to a short squeeze move with enough momentum to push prices higher to around $35.50.
Therefore more advanced traders may consider turning around and go long above $33.00 to capture this short squeeze momentum.
References:
Double Top: stockcharts.com
How to Short a Stock in Double Top Pattern Strategy: www.simple-stock-trading.com
Using Support and Resistance Levels of Relative Strength Index> Technical Analysis for the Trading Professional by Constance Brown, Chapter 1: Oscillators Do Not Travel between 0 and 100.
Like it, Share it, Follow it~
Trading View: BreakOutArtist
StockTwits: stocktwits.com/BreakOutArtist
