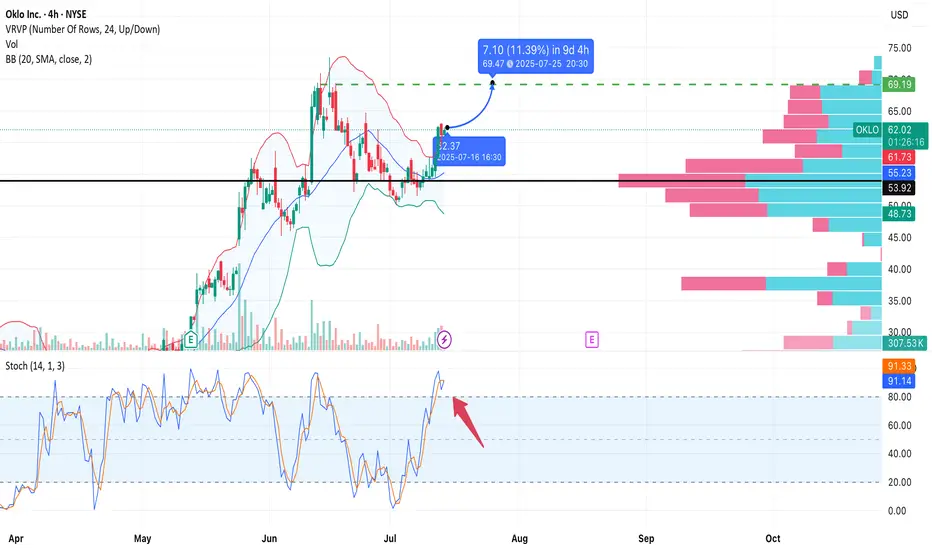
OKLO eyes on $72.37: Golden Genesis fib that should give a DIP OKLO going nuclear into a Golden Genesis fib at $72.37
Looking for a Dip-to-Fib or a Break-n-Retest new longs.
Most likely a few orbits around this ultra-high gravity fib.
.
Last Plot caught break and sister Genesis Fib
.
Older Plot caught the perfect Dip-to-Fib buys:
.
Hit the BOOST and FOL
Next report date
—
Report period
—
EPS estimate
—
Revenue estimate
—
−5.40 USD
−73.62 M USD
0.00 USD
104.74 M
About Oklo Inc.
Sector
Industry
CEO
Jacob DeWitte
Website
Headquarters
Santa Clara
Founded
2013
FIGI
BBG0112CBLW3
Oklo, Inc. engages in the development of fission reactors. It provides clean energy through the design and deployment of fast fission power plants. The company was founded by Jacob DeWitte and Caroline Cochran on July 3, 2013 and is headquartered in Santa Clara, CA.
Related stocks

OKLO – Upside Potential Ahead of EarningsNYSE:OKLO
Type: Swing/positional
Timeframe: 4H
Style: No stop-loss, technically driven
Target: 69.50
Risk: Moderate (earnings volatility risk)
Overview:
Oklo is forming a bullish continuation pattern after consolidating above the 55.00 support area.
The price has broken above the Bollinger Band
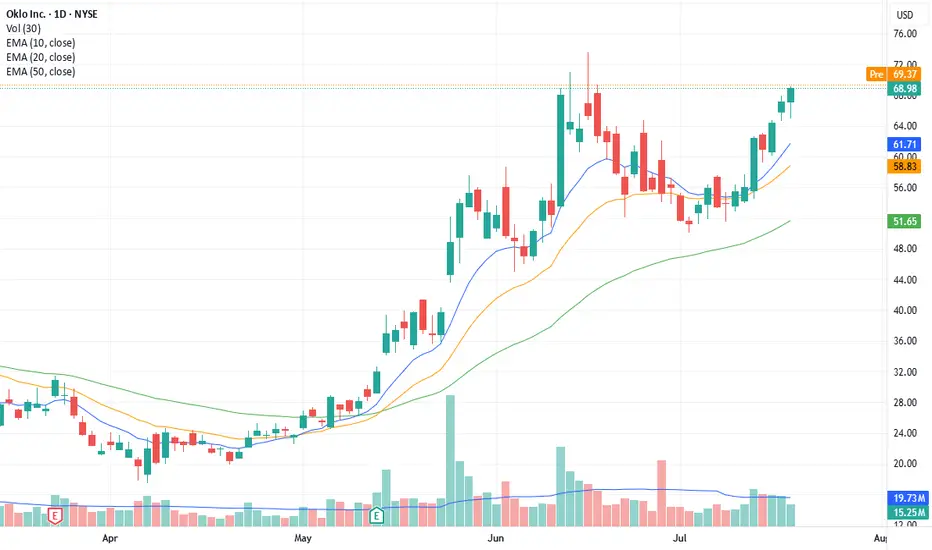
OKLO ($OKLO) — Consolidation After a Powerful Run: What’s Next?NYSE:OKLO After a +180% breakout earlier this year and a strong return above the $60–62 resistance zone, OKLO is now consolidating under $73.40. Let’s break it down 👇🔍 Technical Overview (4H chart)
• Breakout above key resistance ($59–62), which now acts as support.
• Price is consolidating in a

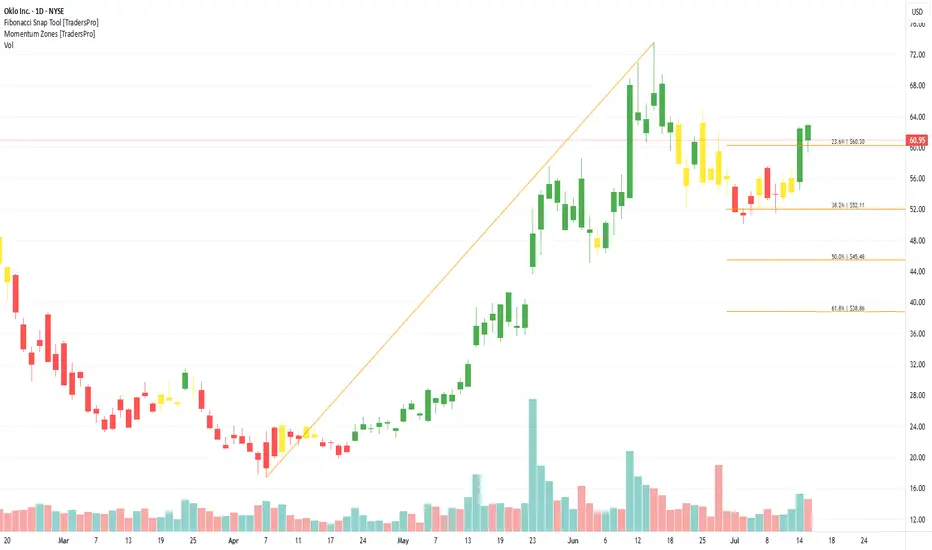
OKLO C&HC&H chart pattern in a hot sector seeing support by the US Government. The intersection of energy, uranium, nuclear, utilities, data centers, the grid, AI, etc.
SL = LL at 58
oklo break out The 14 jul 25 was probably a day to buy. of course hind sight is 20/20 but the chart gave a good indication to enter. risk wise maybe the reward we looking for is too much.
alternatively, there have also been places where the chart looked good but in the end getting stopped out. so likely that thi
Oklo Inc. (OKLO) Builds the Future of Nuclear EnergyOklo Inc. (OKLO) is a nuclear energy company developing compact, advanced fission power plants designed to deliver clean, reliable energy with minimal waste. Its flagship design, the Aurora powerhouse, aims to provide scalable power solutions for remote locations, data centers, and industrial applic
OKLO nice technicals.OKLO after a wonderful cup and handle setup, it has given a breakout and now a pullback to which for me is a great entry position.
Risk aversion.

$OKLO Bullish SetupNYSE:OKLO is setting up a textbook cup and handle breakout on the daily chart, signaling a potential continuation of its impressive uptrend. The cup formed over several months with a rounded bottom, showing healthy accumulation behavior and strong trend structure. Following that, the handle is shap

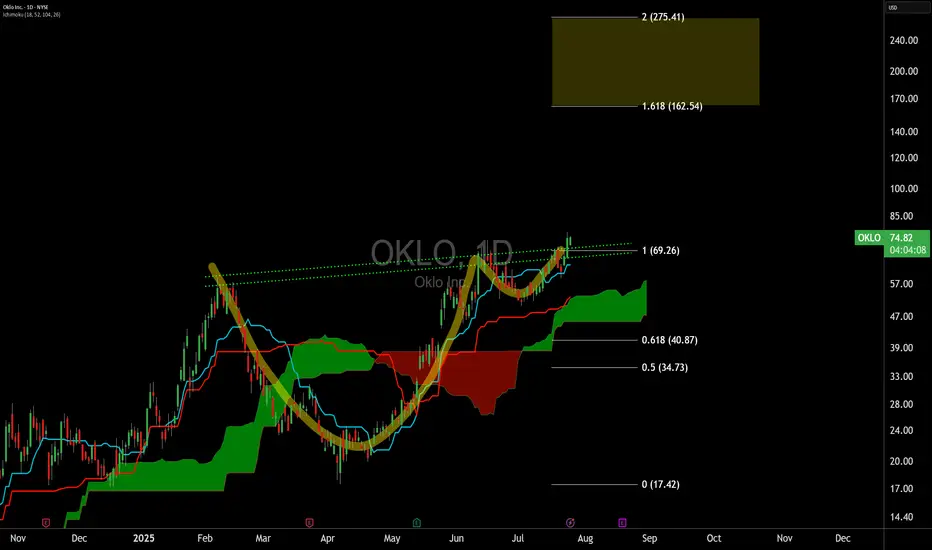
OKLO — when nuclear momentum breaks resistanceSince late 2024, OKLO had been consolidating inside a clear rectangle between $17 and $59. The breakout from this long-term range triggered a new bullish impulse. The price has since returned to retest the breakout zone, now aligned with the 0.618 Fibonacci retracement at $51.94. The retest has comp

$OKLO Gann Chart The symmetry on this Gann chart is superb! It would be healthy if it consolidated a bit to gear up for it's next leg.

See all ideas
Summarizing what the indicators are suggesting.
Neutral
SellBuy
Strong sellStrong buy
Strong sellSellNeutralBuyStrong buy
Neutral
SellBuy
Strong sellStrong buy
Strong sellSellNeutralBuyStrong buy
Neutral
SellBuy
Strong sellStrong buy
Strong sellSellNeutralBuyStrong buy
An aggregate view of professional's ratings.
Neutral
SellBuy
Strong sellStrong buy
Strong sellSellNeutralBuyStrong buy
Neutral
SellBuy
Strong sellStrong buy
Strong sellSellNeutralBuyStrong buy
Neutral
SellBuy
Strong sellStrong buy
Strong sellSellNeutralBuyStrong buy
Displays a symbol's price movements over previous years to identify recurring trends.
Frequently Asked Questions
The current price of OKLO is 75.50 USD — it has increased by 1.22% in the past 24 hours. Watch Oklo Inc. stock price performance more closely on the chart.
Depending on the exchange, the stock ticker may vary. For instance, on NYSE exchange Oklo Inc. stocks are traded under the ticker OKLO.
OKLO stock has risen by 12.38% compared to the previous week, the month change is a 19.65% rise, over the last year Oklo Inc. has showed a 767.82% increase.
We've gathered analysts' opinions on Oklo Inc. future price: according to them, OKLO price has a max estimate of 86.00 USD and a min estimate of 47.35 USD. Watch OKLO chart and read a more detailed Oklo Inc. stock forecast: see what analysts think of Oklo Inc. and suggest that you do with its stocks.
OKLO reached its all-time high on Jun 16, 2025 with the price of 73.55 USD, and its all-time low was 5.35 USD and was reached on Sep 9, 2024. View more price dynamics on OKLO chart.
See other stocks reaching their highest and lowest prices.
See other stocks reaching their highest and lowest prices.
OKLO stock is 6.57% volatile and has beta coefficient of 2.44. Track Oklo Inc. stock price on the chart and check out the list of the most volatile stocks — is Oklo Inc. there?
Today Oklo Inc. has the market capitalization of 11.04 B, it has increased by 16.09% over the last week.
Yes, you can track Oklo Inc. financials in yearly and quarterly reports right on TradingView.
Oklo Inc. is going to release the next earnings report on Aug 19, 2025. Keep track of upcoming events with our Earnings Calendar.
OKLO earnings for the last quarter are −0.07 USD per share, whereas the estimation was −0.10 USD resulting in a 30.12% surprise. The estimated earnings for the next quarter are −0.11 USD per share. See more details about Oklo Inc. earnings.
Oklo Inc. revenue for the last quarter amounts to 0.00 USD, matching the estimated figure, and no changes in revenue are expected for the next quarter.
OKLO net income for the last quarter is −9.81 M USD, while the quarter before that showed −10.29 M USD of net income which accounts for 4.65% change. Track more Oklo Inc. financial stats to get the full picture.
No, OKLO doesn't pay any dividends to its shareholders. But don't worry, we've prepared a list of high-dividend stocks for you.
As of Jul 26, 2025, the company has 113 employees. See our rating of the largest employees — is Oklo Inc. on this list?
Like other stocks, OKLO shares are traded on stock exchanges, e.g. Nasdaq, Nyse, Euronext, and the easiest way to buy them is through an online stock broker. To do this, you need to open an account and follow a broker's procedures, then start trading. You can trade Oklo Inc. stock right from TradingView charts — choose your broker and connect to your account.
Investing in stocks requires a comprehensive research: you should carefully study all the available data, e.g. company's financials, related news, and its technical analysis. So Oklo Inc. technincal analysis shows the strong buy rating today, and its 1 week rating is strong buy. Since market conditions are prone to changes, it's worth looking a bit further into the future — according to the 1 month rating Oklo Inc. stock shows the strong buy signal. See more of Oklo Inc. technicals for a more comprehensive analysis.
If you're still not sure, try looking for inspiration in our curated watchlists.
If you're still not sure, try looking for inspiration in our curated watchlists.