ORA – Long Trade Setup (30m Chart)!🎯
📍 Entry: $84.93 (Breakout confirmation)
🛑 Stop-loss: $86.18 (Below recent wick / resistance)
🎯 Target: $87.81 (Next key resistance zone)
📢 On-Screen Script (7 words per line max):
✅ Breakout confirmed – ORA flying high
📈 Strong trend with volume support
📍 Entry above key breakout zone
🎯 Targeting $87.81 – Risk managed!
ORA trade ideas

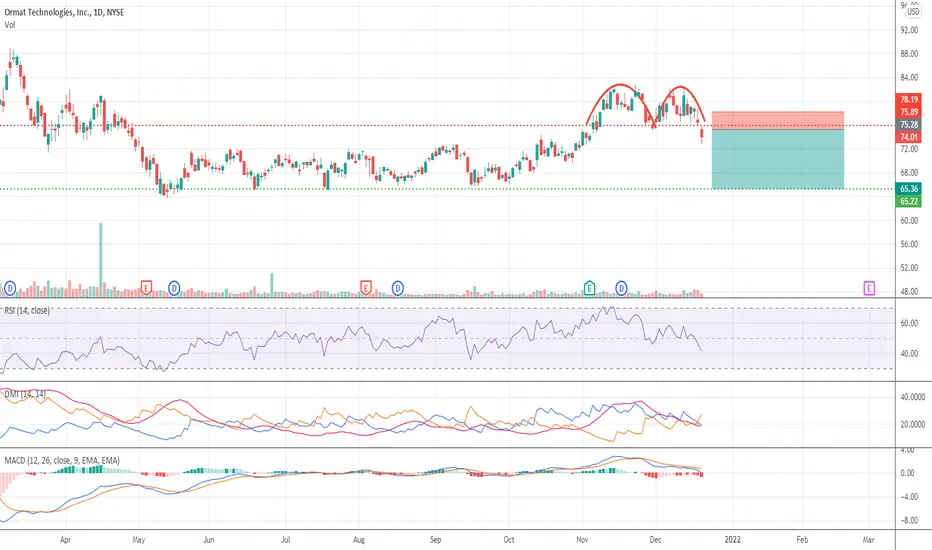
Ormat Technologies - ORAEntry Price: $ 75.28
Target Price : $65.36
Stop loss: $78.19
MACD line is sloping downwards
In DMI the D- is sloping upwards and is above the D+ line
Double top formation with confirmation of the last candlestick which opened below the neckline. Bearish signal from MACD because the indicator is diverging downwards from the signal line. RSI has not reached its support level of 35 yet, so the price is expected to decrease further. ADX shows the trend is not particularly strong (<20), but the D- line closed much higher than D+.
No financial advice.
Ormat Wins a Contract for Products to Support San Jacinto GeotheORA: Ormat Technologies, Inc.
2021-08-11 07:54:33
Ormat Wins a Contract for Products to Support San Jacinto Geothermal Project in Nicaragua

Bullish Divergence. ORA.Is there any particular setup people would like to see me posting consistently? I don't want to leave people behind when I start doing something different. And you would be helping me too because it's always beneficial to make sure the fundamentals are solid.
If you have a concept you'd like me to work through please leave a message below. I get tired of bossing myself around sometimes. Sometimes though, ok, please let's keep it civil if at all possible.


PAY to ORMAT TECHNOLOGIESHello traders, ORMAT TECHNOLOGIES is at a very important moment in its history. We can witness a new historical high. It is in fake bearish composition with a big sell volume giving way and an upside down hammer candle. Zooming in on the TIMEFRAME M1 we see a marubozu with a fake start of sales volume, it goes to its last lowest which is below the bottom of the bollinger. In full bearish swallowing it comes back to test the top of the bollinger then the VWAP to access the top of the range area for a new test of it.
It is very plausible to breakout the price at the same time the zone to land on the high which follows.
And if investors are really back to trading come to the top of the second range to test it before breakout. Then reach the bullish channel top with a symbolic number of 95.00.
Please LIKE & FOLLOW, thank you!

ORA - Bullish Trade SetupSee daily chart for bullish signs. Currently good entry regarding risk / reward.
But Caution: Earnings Report on 4th of August.

$ORA may be setting up longI'm looking for up volume to exceed the down volume on Oct 7 or higher volume over the next few days than down volume in the last 10 days (running). If it does this it could be a nice long candidate. It might be worth your watch list. Be patient.
This may take a few days to develop. If it has more down volume in the next few days it needs to set up again... patience. Ideas, not investing advice

Rally to $60
MACD - Crossover
RSI + Stochastic - Bottom divergence
200 Day MA - above
100 Day MA -converge
50 Day MA - converge
10 Day MA - converge
Volume - slowing down and increasing in price.

Maybe in a week this will be a buyShort term indicator not yet in buy territory, but long term indicators look very positive for a buy in the process of setting up...

ORA Stock Symbol Extremly Strong Flag Pattren The Stock is going up for more then a YEAR !
The main trend is : UP
the Secondary trend : UP ( half year)
Minor trend : Flag pattern
the higher part of the flag was resistence Line , and now as we all can see the same LINE became Support Line.
Yestraday the trading day ended with Huge Green Hammer Chart on the support Line.
and today we got the last confrmesion by geting the next chart closing in even higher Price!.
Take profit : 63.84 (12 %)
StopLoss : 51.55 (10%)
THIS IS MY IDEA AND NOT ADVICE FOR ANYONE!!!
WHAT DO YOU THINK ABOUT IT?
Again i am not giving any advice to anyone to buy the stock , its only to study and tell me what do you think about it


