ORCL Ready for a Pull back before rally to 150 final target?After the drop and downgrade from JP Morgan from 112 to 100. Oracle completed its (4) wave. Possible completing a subwave 1 (blue color), price looks losing steam, so maybe it is time for a healthy pullback to wave 2 (yellow box) and continue for the best wave 3 rally and get the target at the golden ratio.
Of course, news could invalidate this count, but in the bullish scenario, this is the road map I believe could get Oracle to 150 around.
Good luck!
ORCL trade ideas

Bullish weekly swing possibly this Friday 1-26.Thank you as always for watching my analysis. May God bless you!

Oracle's Ambitious Expansion in the Middle East
In a strategic move to capitalize on the Middle East's digital transformation, Oracle ( NYSE:ORCL ) is set to expand its operations in Dubai and build additional cloud infrastructure across the region. The company's Dubai office is undergoing a significant renovation, promising customers an immersive experience in envisioning the future of their companies through cutting-edge AI and cloud technology.
Strategic Investment for a Cloud-Powered Tomorrow
Amid a rising trend channel, Oracle's ( NYSE:ORCL ) stock outlook appears promising, reflecting investor confidence in the company's growth. With plans to invest in a state-of-the-art customer experience center in Dubai, Oracle ( NYSE:ORCL ) aims to offer a futuristic workspace and enable clients to visualize the potential of AI and cloud technology for their businesses.
Cloud Providers Tapping into the Middle East's Potential
Oracle's expansion aligns with the broader trend of global cloud providers establishing a significant presence in the Middle East, particularly in Saudi Arabia and the UAE. Companies like Microsoft, Amazon, IBM, and Alibaba Cloud have already opened cloud and data centers in the region, recognizing the growth potential fueled by a tech-savvy population and government-led digital initiatives.
Oracle ( NYSE:ORCL ), currently managing 67 cloud regions across 26 countries, underscores the Middle East's importance in its global strategy. Clay Magouyrk, Executive Vice President for Oracle Cloud Infrastructure, acknowledges the transformation of the Emirates into a global economic and technology powerhouse, driven by the widespread adoption of cloud services.
Empowering Women in Tech with sAIdaty Initiative
In a move to contribute to the UAE's digital economy goals, Oracle ( NYSE:ORCL ) has partnered with the Dubai Business Women Council to launch the sAIdaty initiative. This year-long program aims to enhance AI skills among women professionals and entrepreneurs. By equipping 500 council members with essential skills, the initiative not only advances women's professional journeys but also aligns with Oracle's commitment to fostering diversity and inclusivity in the tech sector.
Generative AI Integration - A Game-Changer for Enterprise Adoption
Oracle's focus on solving real-world business use cases is evident in its announcement of the general availability of the Oracle Cloud Infrastructure (OCI) Generative AI service. This fully managed service integrates large language models to address diverse business use cases, now supporting over 100 languages. The service's multilingual capabilities, improved GPU cluster management, and flexible fine-tuning options position Oracle as a leader in driving enterprise AI adoption at scale.
Conclusion: Oracle's Cloud-Powered Vision for the Middle East
As Oracle ( NYSE:ORCL ) expands its operations in Dubai and strengthens its cloud infrastructure across the Middle East, the company is not just responding to regional demand but actively shaping the digital future of the area. The combination of technical prowess, strategic partnerships, and a commitment to diversity positions Oracle as a key player in the region's evolving technological landscape. With the integration of generative AI, Oracle ( NYSE:ORCL ) is not only staying ahead of the curve but is also providing businesses with the tools they need to thrive in the era of digital transformation.

Oracle solutions drive surge in its stocksThe IDC MarketScape report, "Worldwide Retail Operations Management Solutions 2023 Vendor Assessment", ranks Oracle's solutions as the best for the retail sector. These are tools for retail trade, cloud services for daily operations management, merchandising, purchasing control, and more. Experts commend the potential of Oracle's new solutions, incorporating elements of artificial intelligence (AI), to modernise outdated IT systems in dozens of countries.
So, today, let's look at the Oracle Corp. (NYSE: ORCL) stock chart.
On the D1 timeframe, resistance has formed at 106.70, with support at 103.29. The upward trend may continue after quotes break through the resistance level. The corrective decline may end after the quotes reach a historical maximum.
On the H1 timeframe, a breakthrough of the 106.70 level could set a short-term target for a price increase at 115.50, while in the medium term, it could hover around 126.00.
—
Ideas and other content presented on this page should not be considered as guidance for trading or an investment advice. RoboMarkets bears no responsibility for trading results based on trading opinions described in these analytical reviews.
The material presented and the information contained herein is for information purposes only and in no way should be considered as the provision of investment advice for the purposes of Investment Firms Law L. 87(I)/2017 of the Republic of Cyprus or any other form of personal advice or recommendation, which relates to certain types of transactions with certain types of financial instruments.
Risk Warning: CFDs are complex instruments and come with a high risk of losing money rapidly due to leverage. 66.02% of retail investor accounts lose money when trading CFDs with this provider. You should consider whether you understand how CFDs work and whether you can afford to take the high risk of losing your money.

$ORCL positioning for a longer term moveHi Traders!
NYSE:ORCL is on the cusp of a gap fill, poised to capitalize on the expanding AI market and the ongoing shift of businesses to cloud computing. Additionally, Oracle's strategic move to establish a regional headquarters in Saudi Arabia could provide notable tax advantages, enhancing its financial positioning and potentially impacting its stock value positively. This strategic geographical expansion, coupled with its tech advancements, positions NYSE:ORCL favorably in the market.

Oracle - great long term hold hereNYSE:ORCL pays a dividend and stands to benefit greatly from AI and future computing demands.
I like $145 - $160 for the next leg up. It sold off pretty hard after their last earnings announcement but that only opens up an opportunity for us!
Happy Trading

ORCLOracle Corporation is an American multinational computer technology company headquartered in Austin, Texas, United States. In 2020, Oracle was the third-largest software company in the world by revenue and market capitalization.
Buy/long candidate.

$ORCL - the next betWhat a start to year 2024. If you referred to my previous post, I entered NYSE:PFE at USD28.79 after a bullish ice cream weekly candle was formed at key support level.
On 2nd January 2024, when the whole market tanked, NYSE:PFE moved up 5% in a day, I was hoping for a higher gain over a longer run but I would prefer to bag 5% gain instead.
Moving on to my second trade of the year, $ORCL. Honestly this is more like a bet trade instead, setup is not too perfect to risk but since the price is testing weekly 50SMA I would expect it to bounce up by 5-10% in 1-2 weeks time. My setup is as follows:
Entry: 102.95
TP: 108 - 114
SL: 99.22
Risk-Reward is not too great but time will tell if my instinct is right.

ORCL Island Reversal! Daily!Island Reversal happened. It is strong chart pattern with huge volume bars.

ORCL Weekly Analysis. It may drop 85$!1) I drew Support Line in the past but it was broken many weeks ago. There was a pull back but prices could not exceed above the Resistance Line. It is still valid for Resistance Line. On the other hand, support line was broken and it is acting like Resistance Line.
2) I drew Resistance Line on RSI indicator and i drew a line there. In my opinion, it will decrease to March and it will continue to rise up again.
3) MACD has red bars and it is still down trend.
4) Momentum 0 Line can be used for strategy and if Momentum Line cuts below 0 Line it is sell sign or down trend.
5) For CCI some technicians are using 0 Line of CCI because +100 and -100 Lines are giving buy and short selling signs very late. CCI cuts below 0 Line and it is sell sign.
6) DMI has 3 moving averages. +DI(blue one), -DI(orange one) and ADX(red one). If ADX cut below -DI it is sell sign.

Oracle: stock down AFTER THE QUARTERLY, bearish Bear Call
"Considering the latest quarterly report from #oracle, Bear Call on $107 / $111 with expiration on 12/22/23. Strategy initiated on 12/13/23. 📆 Rationale: Quarterly analysis and market reaction. 📊 Seize the option wisely! #TradingOptions #BearishStrategy #FinancialOptions. Relying on statistical analysis for support. Monitoring closely and ready for updates and management."

Fundamental Factors Influencing Oracle's Stock at Pivot PointsOracle Corp, the software giant, has reported a slowdown in its cloud computing business, causing its shares to drop more than 7% . The company has projected fiscal third-quarter revenue to be below estimates due to strong competition in the cloud computing market and an uncertain economy, negatively impacting cloud service demand.
According to Bloomberg, this slowdown has fueled investor concerns that the software maker’s expansion efforts have yet to gain ground in the competitive market. Oracle's cloud revenue rose 25% to $4.8 billion in the period ended November 30, after registering a 30% gain in the previous quarter, which represents the second consecutive quarter of slowing growth.
In the fiscal second quarter, Oracle's sales increased by 5% to $12.9 billion, slightly below the average estimate of $13.1 billion. However, the company's profit, excluding certain items, stood at $1.34 per share, beating the average estimate of $1.33.
The company has attributed its slowdown to an uncertain economy and intense competition in the cloud computing market, which has caused a decline in cloud service demand. The news of Oracle's slowdown in cloud computing has caused many to question the company's ability to compete in an increasingly crowded market.

$ORCL Bullish if crosses $117. PT1 $121, PT2 $127Break of trendline above will target previous high $127

ORACLE.....The same chance for Oracle!Hello Traders,
ORACLE, the US listed company shows a similar picture as Upwork did!
Here, a break to the upside is at hand too in the coming hours or days!
Breaking above $117.69 opens the door to $119.72, above that area to $120.82. More bullish potential is in the cards.
On the other hand. A break to the downside @ $115.36 with higher volume turns the level of $113.47 into focus, below that lower to $111.- range.
Here too, the risk/reward is great and well to play with an options trade.
Entry @ a break of $117.69 with targets as described; stop loss @ ~$115.-!
I keep my fingers crossed, for all those who will play this idea!
Have a great week.....
Ruebennase
Please ask or comment as needed.
Trading based on this analysis is at your own risk.

Oracle: Docked! 🔗🚢The ORCL share price continued to climb, reaching the turquoise Target Zone (coordinates: $115.76 - $122.90). The magenta-colored wave (2) should now be completed within this range, the high of which should be followed by a countermovement to the downside. Currently, the upward momentum has flattened somewhat, but can still hold at the high levels. Accordingly, we expect a further rise within the described Target Zone - although from a technical perspective, the minimum requirement of wave (2) in magenta has already been met. After the reversal, we expect the downtrend to continue.

Looking for bearish swing bounce off resistance on ORCL.
As you see here, we are approaching a major resistance zone on the daily heikin ashi candlestick chart. I will be waiting to hit the resistance zone with a heikin ashi line then bounce off with a strong volume. I like this setup a lot.

Oracle potential correction is ON 🚨#usstock :: NYSE:ORCL
#dyor :: ORACLE
Present I am bearish 📍 on it 👍
I belive top is completed 📌
Now 35-45% potential drop we will see
Based on drop and pump 📌 we can decide macro top completed 📌 or not 🚫
Present my target is :: $80-90
( be in follow article under this post update will be provided )

ORACLE: Channel Down bottom buyOracle is on a bearish 1D technical outlook (RSI = 31.499, MACD = -1.720, ADX = 20.020) almost oversold as (with the exception of Aug 29th-Sep 11th) it is trading inside a Channel Down and the price is almost on its bottom. The 1W MA50 may make contact with the price there. This is a buy opportunity regardless (RSI oversold) and our target is the top of the Channel (TP = 106.00).
## If you like our free content follow our profile to get more daily ideas. ##
## Comments and likes are greatly appreciated. ##

A Short Prophecy for OracleDaily chart of ORCL
ORCL formed a large gap when it fell from a double top formation. It wasn't able to fill the gap in its first attempt. It couldn't pass the resistance level of 115 despite five attempts (14-20 Sept).
After bouncing from 105 support level (this was the last peak in Dec 2021), ORCL is attempting to fill the large gap again. It will face stiff resistance at 115.
In the unlikely chance that ORCL crosses this resistance level, it will barely reach 120 since the large gap was formed after a double top and will act as a strong barrier.

Just look at this beautiful chart.
I see massive bullish potential. A lot of profit potential. A lot of open interest on some of the calls. It is looking like a reversal on the weekly and daily chart. Beautiful setup.

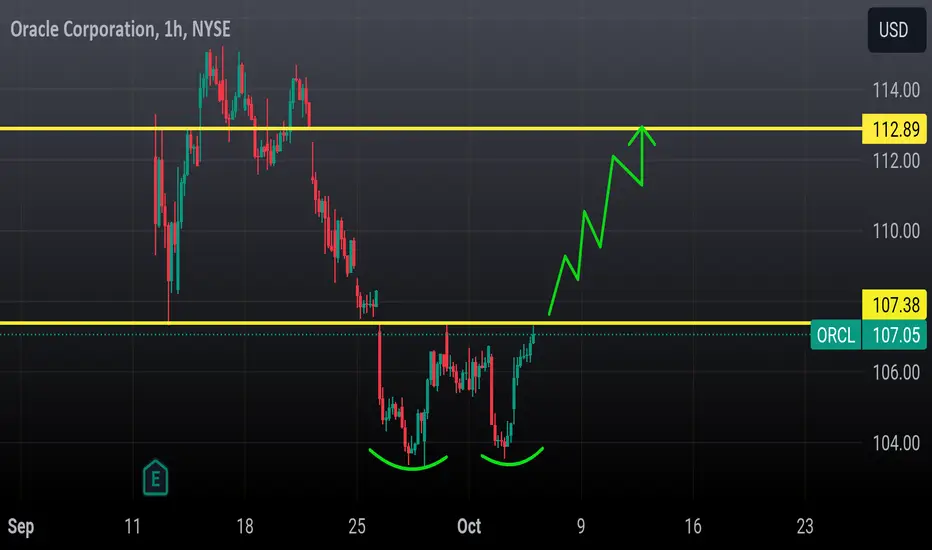
Oracle double bottomDouble bottom here ..
3 gaps into 113
108
109
And 112.89
I'm looking for an immediate 109 gap close by next week and 113 before October is out
ORCL, Crucial, Massive Double-TOP, BEARISH-Triangle Setup!Hello There!
Welcome to my new idea about ORCL. In recent times ORCL already increased with heavy bearish determinations towards the downside as it printed this massive bearish momentum spike candle forming a -15% dump and liquidating almost over 100 Billion positions. Such crucial bearish inclinations should be never underestimated because especially in a time in which the stock market is forming several mixed determinations it is necessary to consider such stocks as ORCL as potential short-side stocks, especially with continued bearish momentum. This is why I have analyzed the main underlying dynamics within the analytics backend to consider to most prevalent crucial dynamics in this current market.
As when looking at my chart ORCL continued to emerge with the major -15% dump from the most severe upper 125 resistance level from where it already pulled back towards the bearish direction in the past. Now, as ORCL emerged with these bearish spikes towards the bearish directions it moved below the previous support levels at 114 and marked several crucial lower lows below this level exaggerating the bearish momentum especially as these previous supports are now major resistances. Furthermore, ORCL dumped below the main 100-EMA and 200-EMA, these two EMAs are now major resistance levels together with the 114 resistance indicating that there is not of a lot possibility for ORCL to turn around and move above these crucial resistances again.
On the bigger global scale ORCL has completed a major double-top formation breaking below the 114 area as marked in my chart, especially as the second top has formed with this accelerated bearish momentum this double-top is the most prevalent formation within this whole determination. Furthermore, now that ORCL has dumped below the main levels it is forming a confirmational triangle formation below the 114 level and this triangle formation is about to be finalized within the next times. The triangle formation will be finalized with ORCL dumping below the lower boundary of the formation as marked in my chart and once this breakout has shown up this is going to be the origin of the wave-C extensions towards the downside. With the completion of the double top and the bearish triangle formation, ORCL will have set up a doubled bearish ABC wave count.
Taking all the major prevalent determining factors into consideration here it has to be mentioned that ORCL is in a crucial bearish development that has the ability to increase with the bearish momentum acceleration every time soon especially as ORCL already confirmed several main bearish determinations here. The completion of this major bearish momentum acceleration is going to form the next -15% dump into the targets of 95 and investor's open interest turning into a bearish sentiment is likely to increase this dynamic to an accelerated determination. It has to be mentioned that not every stock within the market is so bearishly inclined like ORCL, this is why this formation within ORCL is important right now. Such determinations can offer important hedge potential opportunities when considering a total-return approach considering other assets like the DXY and bonds are up, this is going to be an important bearish indication for ORCL as well.
In this manner, thank you everybody for watching my analysis of ORCL. Support from your side is greatly appreciated.
VP

ORACLE: Sharp correction may turn into a 1 year buy.Oracle is having a sharp sell off during September, the strongest since September last year (2022), which formed the market bottom. It is almost oversold on the 1D technical outlook (RSI = 30.957, MACD = -2.920, ADX = 37.867) with the price approaching the 1W MA50, which is untouched since November 7th 2022.
On this 1W chart we have market the time of a 1W MA200 breach that was followed soon after with a strong rebound. Our trading strategy is to enter a long term buy and hold on the 1W MA50 and if by any chance (unlikely) tests the 1W MA100, then unload the rest of longs there. This will be an ideal long term buy opportunity (TP = 130.00).
## If you like our free content follow our profile to get more daily ideas. ##
## Comments and likes are greatly appreciated. ##
