Long Trade Setup Breakdown for Ranpak Holdings Corp. (PACK) 30📊
🔹 Asset: Ranpak Holdings Corp. (PACK)
🔹 Timeframe: 30-Min Chart
🔹 Setup Type: Descending Trendline Breakout
🚀 Trade Plan (Long Position):
✅ Entry Zone: $7.52 (Breakout Confirmation)
✅ Stop-Loss (SL): $7.37 (Below Support)
🎯 Take Profit Targets (Long Trade):
📌 TP1: $7.75 (First Resistance)
📌 TP2: $7.99 (Extended Bullish Target)
📊 Risk-Reward Ratio Calculation:
📈 Risk (Stop-Loss Distance):
$7.52 - $7.37 = $0.15
📈 Reward to TP1:
$7.75 - $7.52 = $0.23
💰 Risk-Reward Ratio to TP1: 1:1.5
📈 Reward to TP2:
$7.99 - $7.52 = $0.47
💰 Risk-Reward Ratio to TP2: 1:3.1
🔍 Technical Analysis & Strategy:
📌 Breakout Confirmation: Strong buying momentum above $7.52 signals continuation.
📌 Pattern Formation: Descending trendline breakout, indicating a bullish move.
📊 Key Support & Resistance Levels:
🟢 $7.37 (Strong Support / SL Level)
🟡 $7.52 (Breakout Zone / Entry)
🔴 $7.75 (First Profit Target / Resistance)
🟢 $7.99 (Final Target for Momentum Extension)
🚀 Momentum Shift Expected:
If price stays above $7.52, it could push towards $7.75 and $7.99.
A higher volume breakout would confirm strength in the trend.
🔥 Trade Execution & Risk Management:
📊 Volume Confirmation: Ensure buying volume remains strong after breakout.
📈 Trailing Stop Strategy: If price reaches TP1 ($7.75), move SL to entry ($7.52) to lock in profits.
💰 Partial Profit Booking Strategy:
✔ Take 50% profits at $7.75, let the rest run to $7.99.
✔ Adjust Stop-Loss to Break-even ($7.52) after TP1 is hit.
⚠️ Fake Breakout Risk:
If price drops below $7.52, be cautious and watch for a retest before re-entering.
🚀 Final Thoughts:
✔ Bullish Setup – If price holds above $7.52, higher targets are expected.
✔ Momentum Shift Possible – Watch for volume confirmation.
✔ Favorable Risk-Reward Ratio – 1:1.5 to TP1, 1:3.1 to TP2.
💡 Stick to the plan, manage risk, and trade smart! 🚀🏆
🔗 #StockTrading #PACK #BreakoutTrade #TechnicalAnalysis #MarketTrends #ProfittoPath
PACK trade ideas

PACK- Prepare for a big pumpPACK- Prepare for a big pump
-ABCD pattern.
-Demand zone support.
-Key level support.
-Less supply vols.
.
US STOCKS- WALL STREET DREAM- LET' S THE MARKET SPEAK!

Looking for $PACK to tighten uplooking for $PACK to tighten up a little more while completing this base around 50 MA
Demand is very visible during its more recent run. Path of least resistance is resumption of the upwards trend.

New highs for PACKSame pattern failing off fib, bouncing off fib on the way down, and moving up >30%.

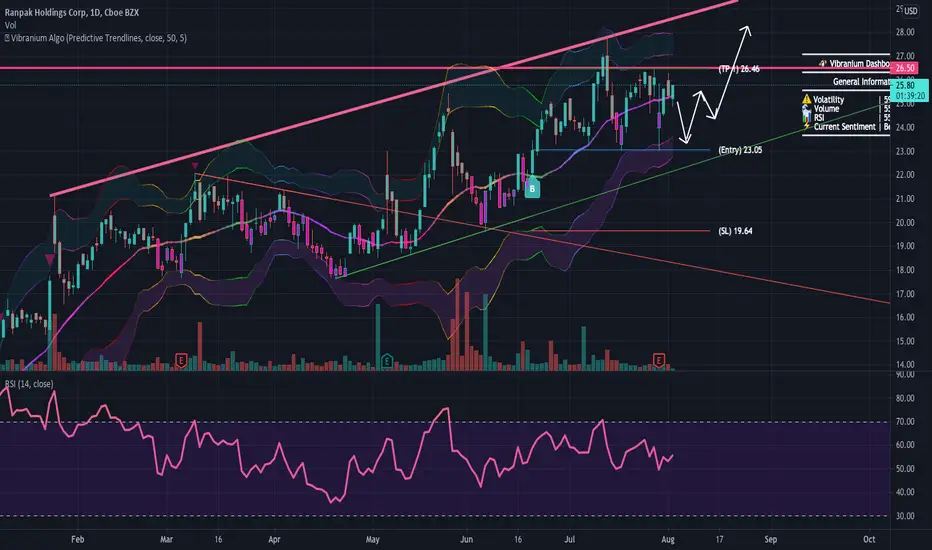
lets look for a dip entry first, then go long. neutral for nowPACK very low volume play so i prefer to look for other names with more volume and attention from big traders/hedge funds. we can look for dip entry around 23-23.5 around the blue line below, stop loss under the green trendline and target 26.4-28 after entry, risk reward isn't bad if we wait for a dip on this one. goodluck ! dont forget to like and follow for more :)

Entering a long positionPeople can do their own research into the fundamentals, but here's my chart.

Broken Resistance Becomes SupportTechnical Analysis 101.
Keep it Simple.
not a chart pattern i would trade a breakout on but good illustration of the Support/Resistance concept.
