PBF“An energy-related company is expected to react to geopolitical news. An inverted head and shoulders pattern has formed, with a breakout above the 23 level being key.
PBF trade ideas

PBF Energy turnaround happening?Fundamentals:
The stock is trading at 0.42x book value, and pays 5.58% dividend. Of course, if profitability deteriorates further, the dividend can be cut and the P/B value can fall lower, but!
PBF is doing a good job on cost cuts, in the last earnings report posted narrower loss than expected
The mexican company 'Control Empresarial de Capital' is continously buying shares of the company, and nor Carlos Slim, neither another insiders-holders selling shares.
Technicals:
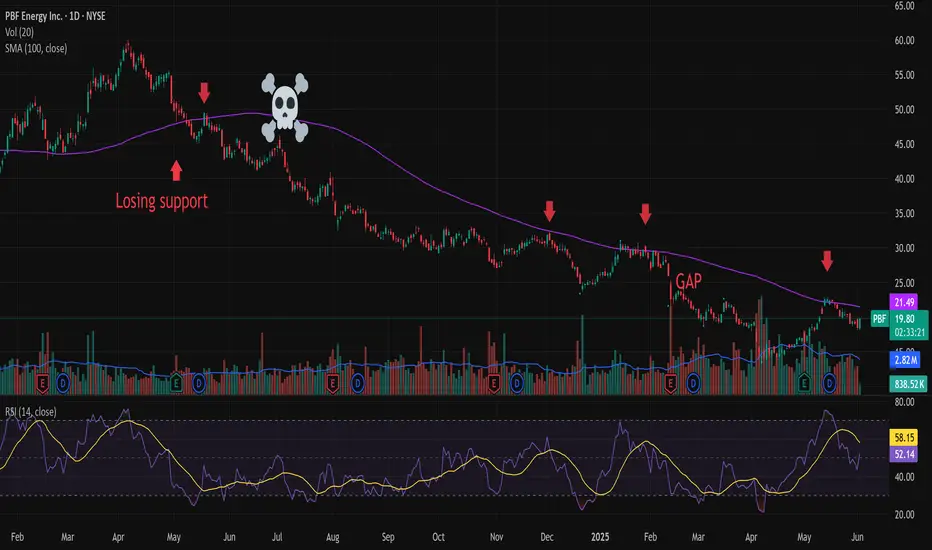
The 100 day moving average is the Boogeyman for PBF Energy.
One year ago, early May 2024 the price lost it, and never got back above.
Death cross happened in 2024 July.
Got rejected by the 100MA 4 times, as seen on the picture. The 50day got under the 100, but not worked as support. In 2025 Jan-Feb it tried, but failed.
Is this time different?
A final washout is already happened to $13.45 in April.
In May 2025, the 100MA rejected the price again, but this time the 50MA held as support.
Now the price battles with the 100MA again, break above means a target of $25, as this is an unfilled gap of 2025 February, and the 200 day MA.
Short-term traders can set $25 as target.
Long-term investors can eye $32-36 with proper risk management, or continous buying-selling. Can take a year or two.
PBF - Long PBF has been in an uptrend and currently has been retracing and resting at a strong support level paired with a Bullish Divergence on the Daily.
Buy Stops above 34 can be placed for a safe ride upwards.

PBF to make a big reversal?🔉Sound on!🔉
Thank you as always for watching my videos. I hope that you learned something very educational! Please feel free to like, share, and comment on this post. Remember only risk what you are willing to lose. Trading is very risky but it can change your life!

PBF upside potential based on TrendPBF has consolidated and seems like it has formed a base.
If it breaks the trendline, we can see upside movement,
First stop loss seems to be at 5% and second at 11%.
Berkshire Hathway has also opened a position in this.

PBF Energy (PBF) - Strategic Partnership and Growth Analysis! 🚀📈 Key Points:
Partnership: PBF Energy recently formed a 50/50 partnership with a division of global energy giant ENI.
Biorefinery Project: The collaboration is focused on supporting the financing of a biorefinery project.
Growth Driver: The biorefinery project is expected to be a significant growth driver for PBF Energy in the coming years.
Capacity Increase: The partnership is set to increase PBF's refining capacity and facilitate entry into key markets.
🔍 Analysis:
Strengths: The collaboration leverages complementary strengths and expertise from both companies.
Market Entry: Entry into key markets aligns with PBF Energy's growth goals.
Macroeconomic Factors: Positive indicators include strong demand for refined products and ongoing geopolitical tensions.
📉🎯 Trading Strategy:
Entry Range: Consider entry above the $41.00-$42.00 range.
Upside Target: Set an upside target in the $72.00-$74.00 range.
Analysis Consideration: Factor in macroeconomic trends and monitor developments in the biorefinery project.
🔄📈 Note: Stay updated on company announcements and market dynamics for informed trading decisions. 🚀💡 #PBF #EnergyStock #TradingAnalysis 🛢️📌


Top Longs 8/28My Top Long Mix Plays at the moment!
These are selected based on Market Cap, Volume and Current Trend.

PBF: Ascending Triangle, Confirmed (78,49%)(18/1000)(18/1000)
Ascending Triangle for PBF.
Confirmed. Possible 78.49% gains.
Pros:
1- Bullish Ascending triangle, Confirmed
2- Descending volume during formation
3- PPS above 50MA and 200MA
4- R/R ratio above 5
5- 250RSI above 50 and ascending
6- 50MA above 200MA
7- 50MA and 200MA ascending.
8- RS above 0 and ascending
Cons:
1- ATR flat, less volatile
2- No high volume at break
Target price is 85,71$.
Again, stay humble, have fun, make money!
MAAX!

PBF Short PositionHi traders.
Let´s wait for the price to retest the resistance zone and enter the short position.
Our estimated target is 32.82$.
Entry and stop loss are showed on the chart.
Good luck!

$ PBF, resistance on 49.10$PBF Energy Inc., together with its subsidiaries, engages in refining and supplying petroleum products. The company operates in two segments, Refining and Logistics. It produces gasoline, ultra-low-sulfur diesel, heating oil, diesel fuel, jet fuel, lubricants, petrochemicals, and asphalt, as well as unbranded transportation fuels, petrochemical feedstocks, blending components, and other petroleum products from crude oil.
Strong earnings should allow management to continue dividend payments
Cash flows can sufficiently cover interest payments
Prominent player in the Oil, Gas & Consumable Fuels industry
Trading at a low revenue valuation multiple
Mizuho Securities analyst raised the price target on PBF Energy (NYSE:PBF) to $56.00 (from $50.00) while maintaining a Buy rating.

$PBF: Bullish trend continuation$PBF is a stock that trends very smoothly, in the daily and weekly timeframe and historically has given us a lot of good trades over the years. It has a low risk buy setup here, so it's worth playing it (also present in $CL_F, so you can trade either of the two, in my case I''m long oil futures but not $PBF yet).
Best of luck!
Cheers,
Ivan Labrie.


PBF Potential Breakout likelyPBF Potential Breakout likely
Watching to see how we react into supply above
if we are able to flag and build at resistance creating an area of support i see further upside highly likely

PBF Energy Inc Triangle BreakoutThe idea here is about PBF Energy Inc:
PBF Energy, Inc. engages in the operation of a petroleum refiner and supplies unbranded transportation fuels, heating oil; petrochemical feed stocks, lubricants, and other petroleum products in the United States. It operates through the following segments: Refining and Logistics. The Refining segment refines crude oil and other feed stocks into petroleum products. The Logistics segment owns, leases, operates, develops, and acquires crude oil and refined petroleum products terminals, pipelines, storage facilities, and logistics assets.
My view is bullish (Swing trade) for the below observed technical factors.
Points as per TA on a weekly & daily Chart:
1.Contracting or Symmetrical Triangle breakout on a weekly & daily chart at the time of publishing as per below:
2. Double Bottom formation under process at the time of publishing as per below:
3. Bearish Navarro 200 harmonic pattern CD leg in progress at the time of publishing as per below:
4. Trading way above 20 & 200 EMA on a weekly & daily chart.
5. Ichimoku Cloud analysis: Kumo Breakout & Kumo Twist on weekly chart is Strong for an upward momentum at the time of publishing. However, Kumo twist on daily chart is weak & kumo breakout and kumo twist is neutral on monthly chart at the time of publishing.
6. RSI is at 58.59 on a weekly Chart and 61.02 on daily chart at the time of publishing.
7. MACD above signal line on daily chart & below signal line and converging on a weekly chart.
8. Hull Moving average is sell on daily & monthly and other moving averages are strong buy. However, weekly Hull Moving average & other moving averages on monthly chart is a strong buy.
9. ADX (Average directional index ) trend strength is at 14.37 on a weekly and 24.83 on a daily chart which indicates a absent or weak trend (ADX between 0-25 is a Absent or weak trend) Projected Target: provided in the chart as per double bottom & Bearish Deep Crab harmonic pattern. Trend is flat at the time of publishing.
Target: Provided in chart for double bottom & bearish Navarro 200.
Stop Loss: Provided in the chart.
Disclaimer: “The above is an Educational idea only and not any kind of financial or investment advice. So please do your own DD (Due Diligence) before any kind of investment”.
Do you like my TA & ideas!!
Want to keep yourself updated with current market action? Then don’t forget boost & to subscribe for more analysis.
Do leave your valuable feedback & comments for any improvisations.
Cheers.

PBF trading in energy with 9 over 21 SMA and looking for swingEnergy has come down a fair amount over the past 3 months. With winter coming and the EU out of energy, I expect energy to swing higher and PBF has an appealing chart with the 9 day crossing over the 21 day. I expect a 2-3 month hold on this chart.
Exit around 46
Stop at 30

PBF overboughtLooking for a scalp under $39- 38. Sold short 2,000 shares this morning average $40.50. Will add again at $42, 43, 44 etc. Looking to buy PUTS over $43.00

PBF broke out of the head and shoulder patternNYSE:PBF is still lagging behind compared to the energy sector but is currently trying to catch up. It recently broke out of the inverse head and shoulders pattern, any pullback towards the neckline is a buy opportunity. Targets and anticipated price action is shown on the chart, stop loss daily close below 20 MA.
targets and anticipated price action are shown on the chart, stop loss is weekly close below 9.28$.
Hit the like button please if you find this useful :)
This is only my own view and not financial advice, do your own analysis before buying or selling
Happy Trading!

PBF pullback reentryPBF pullback into earnings/post earnings
entry 1 at 21
entry 2 at 18.50
STD dev channel / volume profile/Ema


$PBF 5 Months Cup with Handle$PBF in the oil sector. Very defined 5 months cup and handle pattern. One strike is the depth of the cup with is 60%. A bit wee too much for my liking but really like that right side


