Proof of the .65 - In 3D - QSThe Golden Pocket, based in the power of Phi, consists of the .618 to the .65. Included the mathematical rationale for why price reacts to the .65 level.
QS trade ideas

Quantumscape (QS) : Cheer up to gap filledLithium-metal batteries for use in electric car
Continue rebound from dip
Please keep an eye this stock will breakout resistance & fill gap or not

$QS QUANTUMSCAPE CORPORATION Falling Wedge Tracking$QS formed a huge Falling Wedge and recently tested the Fibo 0.786 level. EMA20 just crossed SMA50 down on 4h chart which confirms bulls have been weak for a while. RSI 14 also declines. Now I have two scenarios for breaking out of the wedge. Either retry Fib 0.786 level or start a new trend now. No matter where it does break, $QS has a potential of minimum $70+ profit per stock. Watch for break out of the wedge and buy on re-test. I don't expect and dip below $29.

little quantum shortwhile i await to take on a long term position, i'm taking a little short here for the time being :^)

QS down almost 13% tooWe had a 30% gain but we did not sell, now we are down 13%, what a volatile market

Quantum-Escaped? 🎡 ($350 PT)Chart requested by: @talentadvisormadhan
$QS is currently in sub-wave 4 of wave C, look for the final push down into the golden buy zone in the weeks ahead.
Wave 3 target sits at $350
This won't happen overnight, but this is a solid long term hold if you're into their tech.

$QS still in a wedge that may break to a huge upside 100-160QS is a name that many institutions and big investment firms supporting. This new Battery evolution is not only meant for EV, think beyond, Laptops, Wearables, smartphones etc.


QS - the Lance Armstrong - Down to $22 we GoNote the special shape that's appearing on every stock. PP - Lance Armstrong Edition
I think God is trying to send us a message, or maybe it's the other guy given the message.
21.87 looks like the next support level and happens to coincide with a FIB number.


CCIV - WHAT YOU HAVNT NOTICED - A QS REPLICA? As you can be by the following my previous idea was based was QuantumScape. The new opportunity arised when i saw that the 2 charts, are mostly identical in terms of price action and technical analysis.
1. CCIV have had 5 major waves down, finishing off at the 2.618 trend-based fib-Extension. QS has the exact same level of 2.618 where it bounced of the last time.
2. On the 15min chart we can see that QS and CCIV are hovering around the same RSI level: 18. If this is true, CCIV is likely to break up here.
3. After the QS long, QS had a return of 75%. If the compare the two it should put CCIV at 42 USD.
Remember to give this a like, and i will keep this updated with daily technical analysis.
May the chart be with you.
Previous QS IDEA:

bull thesis for solid state lithium battery developmentAlready sitting on a small position, although I'm cognizant that the next couple days can determine how $QS trades for the next couple weeks. Stiff resistance from above on a downward trend line from its ATH coupled with fairly soft support down here suggests it could easily grind sideways-to-down if it doesn't catch a bid at this next inflection point.
(It does like the $55,00 support but hangs out helplessly below that for extended periods as well.)
Should it manage to break through, a nice opportunity potentially lies in the upper right quadrant. 🤙🏽


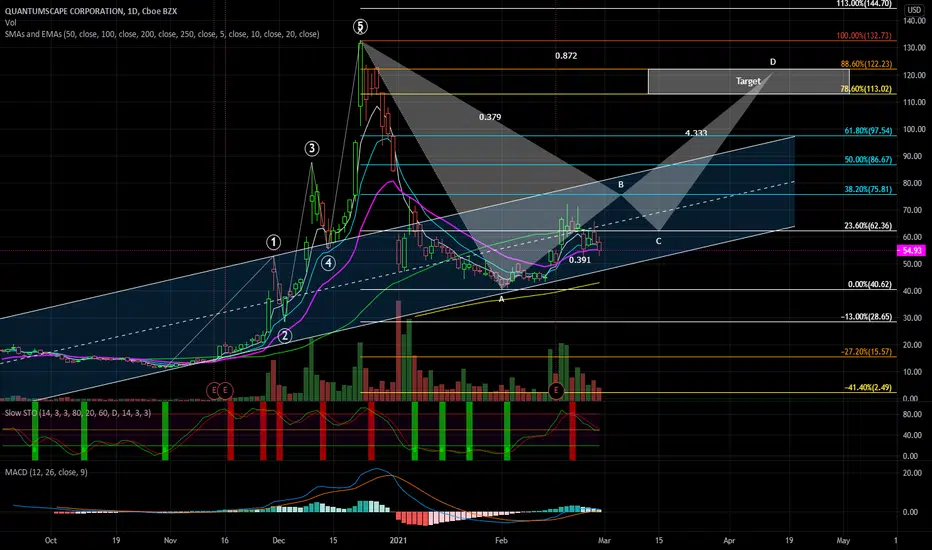


$QS Long-Elliot Wave AnalysisWave 2 appears to be completing a double zig-zag correction: 3-3-3.
Scenario 2: A break below $55 could potentially result in a regular flat: 3-3-5 with .618 extension at $49.50.
If current projection holds, Wave 3 completion price target is $90-100 for March 19th 75C.
If Wave 2 completes a 3-3-5 correction, Take April 16th 65C at $50, and 75C on the sub-2 pullback of wave 3
Volume dry-up with no significant change in underlying further corroborates the proposed wave 2 corrections.


