Ryder System Stock Qoute | Chart & Forecast SummaryKey Indicators On Trade Set Up In General
1. Push Set Up
2. Range Set up
3. Break & Retest Set Up
Notes On Session
# Ryder System
- Double Formation
* WXY Wave Correction | Ranging Entry | Subdivision 1
* 136.00 USD | Support Area
- Triple Formation
* Retracement | Wave Y = 50% | Subdivision 2
* 1
Next report date
—
Report period
—
EPS estimate
—
Revenue estimate
—
11.96 USD
486.00 M USD
12.64 B USD
39.49 M
About Ryder System, Inc.
Sector
Industry
CEO
Robert E. Sanchez
Website
Headquarters
Coral Gables
Founded
1933
FIGI
BBG000BRVP70
Ryder System, Inc. is a logistics and transportation company, which engages in providing supply chain, dedicated transportation, and fleet management solutions. It operates through the following business segments: Fleet Management Solutions (FMS), Supply Chain Solutions (SCS), and Dedicated Transportation Solutions (DTS). The FMS segment provides full-service leasing and leasing with flexible maintenance options, commercial rental and maintenance services of trucks, tractors, and trailers. The SCS segment provides integrated logistics solutions, including distribution management, dedicated transportation, transportation management, e-commerce and last mile, and professional services. The DTS segment provides turnkey transportation solutions, including dedicated vehicles, drivers, management, and administrative support. The company was founded by James A. Ryder in 1933 and is headquartered in Coral Gables, FL.
Related stocks

Within 2 Weeks - This company Will Report Earnings *Updates*According to an article written on Reuters, which i found
on the breaking news app right here on Trading View,
--
This stock's performance year to date is up by about 12%
and within 2 weeks the company is going to announce its earnings report.
--
Also, they have increased their dividend shares
Plea

RYDER TRUCKING WARNING A TOPPING PHASEThe chart is the Ryder trucking It is forming what W.D. Gann and elliot would call A stock which time has come to leave and say thank you . Tbills and TIPS would be the better place for your money. for the next leg of the BEAR

Ryder On The StormNYSE:R
Ryder is breaking down, looking to see it fall to the Energy Points noted on the chart.
Energy Point #1: April 18th @ $83.50
Energy Point #2: Mid-July to Early-August @ ~ $75
Fat_Fat

R is a Stock 2 WatchLiking the chart for R. In a strong sector showing relative strength. Price has pulled back after a breakout from a broad range. Looking at the green box for an entry. Tight stop below the green box or below the 618 Fib for longer term holds. Targets would be recent high then Fib extensions. As alw

R SELL++++Ryder stock recently broke out after many years, I would expect it to test $84 before possibly making a new 52 week high which is common after a recently breakout to retrace. If currently short I would ADD $95, $97, $99 and take profit under $88

Ryder through 85 in timeWeekly chart here for Ryder, daily chart indicating buy through 83, with an add through 85. Would love to see the daily chart consolidate here under 85 for a couple of days finishing with a volume spike through 85 in time. 85 seems to be a huge macro level dating back to May 2021.

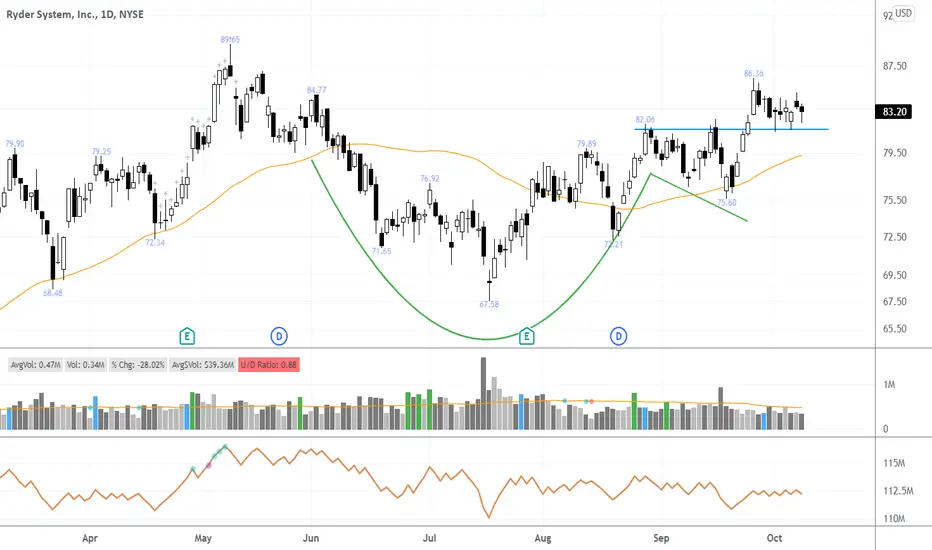
$R Cup with Handle Pullback Setup$R 4 months cup with handle pullback setup.
It broke out couple weeks ago from handle pivot $82.06 couple weeks ago & pulled back to that level to correct the wedgy looking breakout.
The volume pattern could have been a bit more convincing but this is a decent setup.

RYDER: $40 Short Sell TargetFirst off, please don't take anything I say seriously or as financial advice. As always, this is on opinion basis. That being said, I want to make a few points. Ryder had its recent earnings call today, which overall wasn't positive but still beat many estimates and expectations. Given that, the gro

See all ideas
Summarizing what the indicators are suggesting.
Neutral
SellBuy
Strong sellStrong buy
Strong sellSellNeutralBuyStrong buy
Neutral
SellBuy
Strong sellStrong buy
Strong sellSellNeutralBuyStrong buy
Neutral
SellBuy
Strong sellStrong buy
Strong sellSellNeutralBuyStrong buy
An aggregate view of professional's ratings.
Neutral
SellBuy
Strong sellStrong buy
Strong sellSellNeutralBuyStrong buy
Neutral
SellBuy
Strong sellStrong buy
Strong sellSellNeutralBuyStrong buy
Neutral
SellBuy
Strong sellStrong buy
Strong sellSellNeutralBuyStrong buy
Displays a symbol's price movements over previous years to identify recurring trends.
US78355HKR9
RYDER SYSTEM 20/25 MTNYield to maturity
8.24%
Maturity date
Sep 1, 2025
R5678093
Ryder System, Inc. 6.6% 01-DEC-2033Yield to maturity
4.82%
Maturity date
Dec 1, 2033
R6009360
Ryder System, Inc. 5.0% 15-MAR-2030Yield to maturity
4.54%
Maturity date
Mar 15, 2030
R5294387
Ryder System, Inc. 1.75% 01-SEP-2026Yield to maturity
4.48%
Maturity date
Sep 1, 2026
R5927759
Ryder System, Inc. 4.9% 01-DEC-2029Yield to maturity
4.47%
Maturity date
Dec 1, 2029
R5861388
Ryder System, Inc. 4.95% 01-SEP-2029Yield to maturity
4.42%
Maturity date
Sep 1, 2029
R4909362
Ryder System, Inc. 2.9% 01-DEC-2026Yield to maturity
4.42%
Maturity date
Dec 1, 2026
R5761674
Ryder System, Inc. 5.375% 15-MAR-2029Yield to maturity
4.39%
Maturity date
Mar 15, 2029
R5803161
Ryder System, Inc. 5.5% 01-JUN-2029Yield to maturity
4.38%
Maturity date
Jun 1, 2029
R5366986
Ryder System, Inc. 2.85% 01-MAR-2027Yield to maturity
4.33%
Maturity date
Mar 1, 2027
R6064900
Ryder System, Inc. 4.85% 15-JUN-2030Yield to maturity
4.26%
Maturity date
Jun 15, 2030
See all R bonds
Frequently Asked Questions
The current price of R is 173.92 USD — it has decreased by −2.77% in the past 24 hours. Watch Ryder System, Inc. stock price performance more closely on the chart.
Depending on the exchange, the stock ticker may vary. For instance, on NYSE exchange Ryder System, Inc. stocks are traded under the ticker R.
R stock has fallen by −1.03% compared to the previous week, the month change is a −1.62% fall, over the last year Ryder System, Inc. has showed a 30.31% increase.
We've gathered analysts' opinions on Ryder System, Inc. future price: according to them, R price has a max estimate of 215.00 USD and a min estimate of 183.00 USD. Watch R chart and read a more detailed Ryder System, Inc. stock forecast: see what analysts think of Ryder System, Inc. and suggest that you do with its stocks.
R stock is 3.88% volatile and has beta coefficient of 1.22. Track Ryder System, Inc. stock price on the chart and check out the list of the most volatile stocks — is Ryder System, Inc. there?
Today Ryder System, Inc. has the market capitalization of 7.25 B, it has increased by 1.16% over the last week.
Yes, you can track Ryder System, Inc. financials in yearly and quarterly reports right on TradingView.
Ryder System, Inc. is going to release the next earnings report on Oct 23, 2025. Keep track of upcoming events with our Earnings Calendar.
R earnings for the last quarter are 3.32 USD per share, whereas the estimation was 3.13 USD resulting in a 6.07% surprise. The estimated earnings for the next quarter are 3.57 USD per share. See more details about Ryder System, Inc. earnings.
Ryder System, Inc. revenue for the last quarter amounts to 3.19 B USD, despite the estimated figure of 3.18 B USD. In the next quarter, revenue is expected to reach 3.19 B USD.
R net income for the last quarter is 130.00 M USD, while the quarter before that showed 97.00 M USD of net income which accounts for 34.02% change. Track more Ryder System, Inc. financial stats to get the full picture.
Yes, R dividends are paid quarterly. The last dividend per share was 0.81 USD. As of today, Dividend Yield (TTM)% is 1.82%. Tracking Ryder System, Inc. dividends might help you take more informed decisions.
Ryder System, Inc. dividend yield was 1.94% in 2024, and payout ratio reached 27.50%. The year before the numbers were 2.31% and 30.46% correspondingly. See high-dividend stocks and find more opportunities for your portfolio.
As of Aug 12, 2025, the company has 50.7 K employees. See our rating of the largest employees — is Ryder System, Inc. on this list?
EBITDA measures a company's operating performance, its growth signifies an improvement in the efficiency of a company. Ryder System, Inc. EBITDA is 3.00 B USD, and current EBITDA margin is 21.70%. See more stats in Ryder System, Inc. financial statements.
Like other stocks, R shares are traded on stock exchanges, e.g. Nasdaq, Nyse, Euronext, and the easiest way to buy them is through an online stock broker. To do this, you need to open an account and follow a broker's procedures, then start trading. You can trade Ryder System, Inc. stock right from TradingView charts — choose your broker and connect to your account.
Investing in stocks requires a comprehensive research: you should carefully study all the available data, e.g. company's financials, related news, and its technical analysis. So Ryder System, Inc. technincal analysis shows the neutral today, and its 1 week rating is buy. Since market conditions are prone to changes, it's worth looking a bit further into the future — according to the 1 month rating Ryder System, Inc. stock shows the buy signal. See more of Ryder System, Inc. technicals for a more comprehensive analysis.
If you're still not sure, try looking for inspiration in our curated watchlists.
If you're still not sure, try looking for inspiration in our curated watchlists.