Ryder System Stock Qoute | Chart & Forecast SummaryKey Indicators On Trade Set Up In General
1. Push Set Up
2. Range Set up
3. Break & Retest Set Up
Notes On Session
# Ryder System
- Double Formation
* WXY Wave Correction | Ranging Entry | Subdivision 1
* 136.00 USD | Support Area
- Triple Formation
* Retracement | Wave Y = 50% | Subdivision 2
* 176.40 USD | Pennant Structure | Subdivision 3
* Flag Structure | 183.65 USD Continuation Entry
Active Sessions On Relevant Range & Elemented Probabilities;
London(Upwards) - NYC(Downwards)
Conclusion | Trade Plan Execution & Risk Management On Demand;
Overall Consensus | Buy
R trade ideas

Within 2 Weeks - This company Will Report Earnings *Updates*According to an article written on Reuters, which i found
on the breaking news app right here on Trading View,
--
This stock's performance year to date is up by about 12%
and within 2 weeks the company is going to announce its earnings report.
--
Also, they have increased their dividend shares
Please read more on the breaking news app
--
on the trading view screen to find out more.
--
Now i want to share with you about the Rocket Booster strategy
It has 3 steps:
--
#1-The 50 Moivng average
#2-The 200 Moving average
#3-The gap up trend
--
If you want to find out more about this strategy in detail and how i found this stock as a good buy
Rocket boost this content To learn more.
Disclaimer: Trading is risky you will lose money whether you like it or not please learn risk management and profit-taking strategies.

RYDER TRUCKING WARNING A TOPPING PHASEThe chart is the Ryder trucking It is forming what W.D. Gann and elliot would call A stock which time has come to leave and say thank you . Tbills and TIPS would be the better place for your money. for the next leg of the BEAR

Ryder On The StormNYSE:R
Ryder is breaking down, looking to see it fall to the Energy Points noted on the chart.
Energy Point #1: April 18th @ $83.50
Energy Point #2: Mid-July to Early-August @ ~ $75
Fat_Fat

R is a Stock 2 WatchLiking the chart for R. In a strong sector showing relative strength. Price has pulled back after a breakout from a broad range. Looking at the green box for an entry. Tight stop below the green box or below the 618 Fib for longer term holds. Targets would be recent high then Fib extensions. As always must have support of broader market. ie do not enter long if the market is weak or selling off.

R SELL++++Ryder stock recently broke out after many years, I would expect it to test $84 before possibly making a new 52 week high which is common after a recently breakout to retrace. If currently short I would ADD $95, $97, $99 and take profit under $88

Ryder through 85 in timeWeekly chart here for Ryder, daily chart indicating buy through 83, with an add through 85. Would love to see the daily chart consolidate here under 85 for a couple of days finishing with a volume spike through 85 in time. 85 seems to be a huge macro level dating back to May 2021.

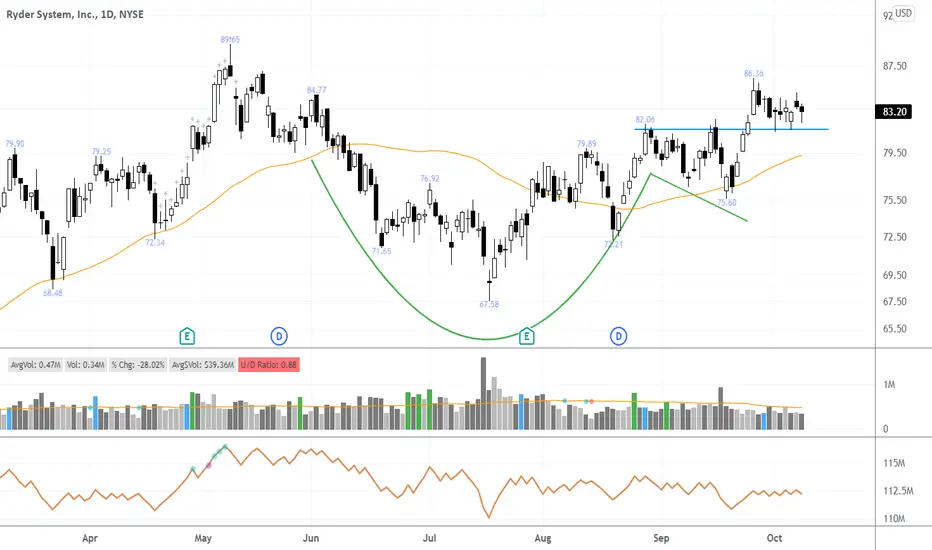
$R Cup with Handle Pullback Setup$R 4 months cup with handle pullback setup.
It broke out couple weeks ago from handle pivot $82.06 couple weeks ago & pulled back to that level to correct the wedgy looking breakout.
The volume pattern could have been a bit more convincing but this is a decent setup.

RYDER: $40 Short Sell TargetFirst off, please don't take anything I say seriously or as financial advice. As always, this is on opinion basis. That being said, I want to make a few points. Ryder had its recent earnings call today, which overall wasn't positive but still beat many estimates and expectations. Given that, the growth potential isn't as much as it could be, however it shouldn't meet a bearish run as a result. I think given the potential growth correlations for the next few month, it could still peak towards or past the $40 threshold.


Ryder Systems Short 1 Buy: 72.00
Sell 68.00
Stop 75.00
duration: a little under a month.
5000 @ 2% risk = 33 shares.

#R #stock #short
R is leaning down. There are targets within each timeframe. The most promising of which is the daily target of $66.
monthly
indicators are breaking down on monthly. this signals a possible trend break in the near future. That would give a target in the low $50s.
Weekly
all indicators pointing down. price has formed a right leaning H&S. target is in the upper $50s.
Daily
Here again you can see the H&S in the price action. You can also see the right shoulder has formed an upside down flag. A price projection into the $66 area.


R- BREAKING DOWN CHANNEL, SHORT NOW - Weekly view R is now resuming it's down trend after Retrieving up-to 50% Fibonacci level in weekly chart.
Entry confirmation will be breaking down of channel in daily frame.
Entry: 62
Target: 57.63
We are also looking to Buy Nov16, 62.5 put, Currently trading $3.70

R- Breaking down Channel, Short NowR is now resuming it's down trend after Retrieving up-to 50% Fibonacci level in weekly chart.
Entry confirmation will be breaking down of channel in daily frame.
Entry: 62
Target: 57.63
We are also looking to Buy Nov16, 62.5 put, Currently trading $3.70

Ryder Inverted Head and Shoulders Trend bounceBounce off Trend line and Reversal Pattern
57.90 trigger bullish watching long term average as resistance

R reversal definitely very near10dma is about to cross-over 30dma in the meanwhile MACD is about to cross-over 0. All in all a couple of days of sideways movement will set Ryder up for higher prices. Broke the down-trend today as well. On Watchlist!
