Roblox trade setup$RBLX broke out above this intermediate-term trendline and is consolidating. Active traders can use Friday's candle for both an entry and stop. Swing trading in this market environment has not been working lately, but if you wanted to try, give it a little more room if it triggers. Possibly a stop around $78.00
RBLX trade ideas

Looking to play RBLX break and retestWaiting for RBLX to pull back and hold $83 range. If $83 holds $90+ will be the first quick target.


TrendyTrades: RBLX AnalysisHolding anchored VWAP, price at a good place here to go long. Two scenarios. If we drop, probably won't go further than 80.58 before bouncing.

$RBLX: Roblox has massive upside...$RBLX has come a long way down and found support at previous accumulation levels, we had a nice jump, as bulls expect earnings to go well. I'm bullish on the in game economy and the popularity of the game rising periodically. I do like the chart a lot here as well, and reward to risk is very good, so a buying opportunity on dips is in the cards. Keep an eye on it, if you are up for the year, you can risk buying before the earnings report, if not, wait to buy the next dip into support AFTER the earnings report is out of the way.
Best of luck,
Ivan Labrie.


08/11 Watchlist Hey everyone SamC here, we are going to start posting some set ups for the following trading day of a couple names we are watching. Feel free to ask questions in the comments and give us a follow.

RBLX ER MondayFalling Wedge breakout - Watch for a break above 28.25, the VWAP and resistance where the stock closed the past two trading days. Long above 86, and short below 82.

Roblox. Buy? Sell?Hello, everybody! And welcome to my profile @HankGamez47. I'm a young, specifically an 11 year old boy. I am interested in stocks.
Anyway, I'm here to tell you my predictions on this stock. Since I get a lot of hate on cryptos I'm trying out a non-crypto stock.
The stock I'm talking about today is my favorite video-game and is a newer stock. It's called Roblox!
Many people have bought this stock. Even a gaming YouTuber bought this. Ok, now to actually talk about the stock.
The Reason To Buy Roblox: Roblox is soon having a thing called an "earnings report". It's where it tells them how much money they made.
It comes out August 16th 2021 and its expected to be good, but u can never really trust a prediction. AND NO THIS IS NOT A PREDICTION, IT'S FACTS.
Anyway when the earnings report comes out it will most likely skyrocket for a couple days. Then it will come back down and maybe something will happen
like they made a trade and gained a couple million dollars. Or maybe something bad will happen like a lawsuit which whey are in right now.
If they lose this lawsuit then their stock will go on a bear run. By the way the law suit is suing them for around 200 million dollars.
THAT'S A LOT OF MONEY. Their net-worth is around 2 billion dollars, as of August 2021.
Well if you read all this then thanks for reading! Please like my idea!

Gorgeous chart of $RBLX too easy (with confirmation)Not sure what else we need here to long? Great bounce out of the pendant with backtrace confirmation of support + a sideways day.


Looking for a breakout from this pattern in RBLXAfter consolidating and holding a level, RBLX looks like it might be ready to break out.

RBLX descending triangle above 78 for long. Target 90-95Descending triangle on a daily chart. Came back down to retest the 76-78 area.
Break above 78 could go to 90-95 level.
5% of the portfolio
Stop-loss 73

$RBLX Gartley. Watch for pullback on this one $RBLX Wait for pullback use highlighted box. sim tp1 ang got stop to even
Last $RBLX gartley went off

RBLX I found a good position in this chat the final target is 90
so I putting a target step by step to achieve the final goal
the stop lost is 79

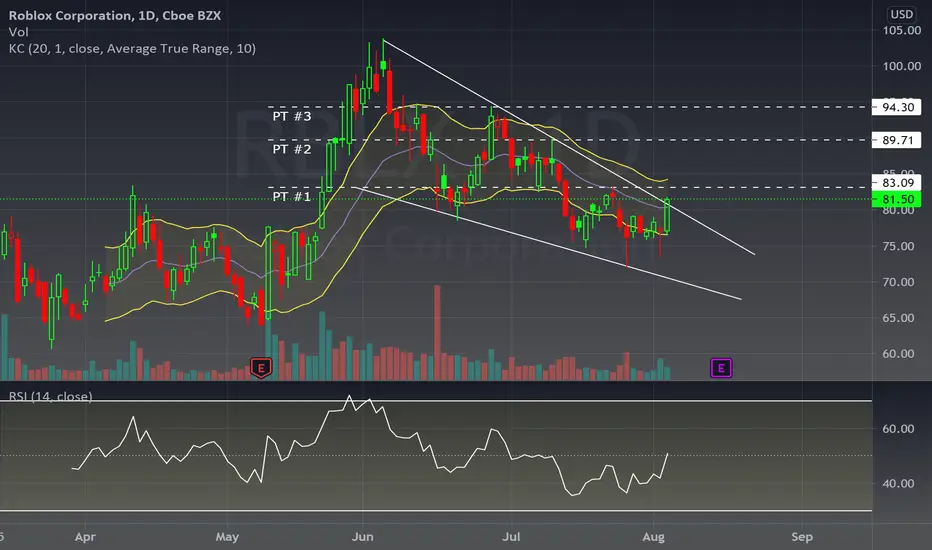
SWING UPDATE: RBLX Looks like RBLX retested the trendine hoping for a bounce up to PT #1 tomorrow. Keep in mind ER is coming up!
Not financial adivce just my opinion.

RBLX - ROBLOX EARNINGS PLAYRoblox to release earnings on 8/16. We're seeing some heavy call flow come in and the setup looks clean from a technical standpoint. We have a break of resistance, that has now turned support on the 1H and 4H timeframes. This could go up quite a bit potentially.

$RBLX tight base break, holding the breakout from the base so far, but need to break above the overhead resistance for a strong move out

Gann Box - Drawn Over RBLX 8/5 [LONG]Pre-market analysis of the 1-Day Time frame for RBLX.
Gann Box drawn to predict future support & resistance areas.

Bull Flag BrokenRBLX has broke bull flag and it has a chance of continuation of momentum. Watch for bullish momentum.

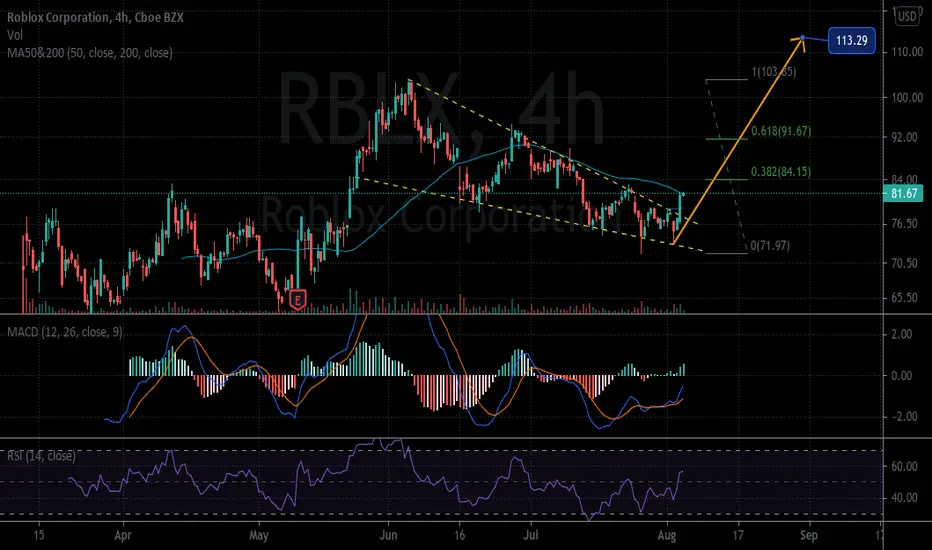
RBLX⬆BULLISH
Mkt Cap $44.16B
RBLX $81.05 AH
Bullish, falling wedge
Price target $91.67/ 103.85/ 113.29
Stop lot $71.97
IMO
$rblx breakout comingbreaks upper trendline, begins uptrend. you can get in early. began a position today

SWING IDEA #21: RBLXFalling Wedge RBLX, TP's listed. Was supposed to post yesterday but fell asleep.