Bullish case for RCLThis 60m chart shows an extremely bullish outlook for RCL. Following a three-wave correction from $130 to $90 in late 2018, the stock has rallied in what appears to be a five-wave move higher. Price has broken above the prior B-Wave swing high and is setting up for a new series of higher-highs / higher-lows. With a bull flag forming above key Fibonacci support levels, there is a chance that a break higher from here could quickly accelerate into an extended Wave-3 rally. I'm looking to establish long positions on a break of the short-term corrective channel as well as a spike in momentum (RSI through trendline resistance). However, RCL could easily continue to chop sideways from here in some form of correction, so it's best to wait for confirmation and not rush the entry.
RCL trade ideas

RCL beware of the big dropIts a clear five wave to the upside which should be corrected ...the target must be the end of the previous fourth wave.

Covered Strangle for Dividend Capture Enhancement (75% prob)Bought 100 RCL for 118.25
Ex-Dividend is tomorrow and dividend is .70, so If I have the stock by tomorrow I will receive the dividend.
To enhance the trade I also Sold the 115/119 Strangle for an additional $1.1 with 3 days to expiration (That's how long I will be in this trade)
Max win would be $185 for the covered strangle plus $70 for the dividend = $255
My break even counting the dividend is 116.45
So I have 1.5% protection to the downside.
This gives us about 75% probability to make money

BIG GREENRCL showed up a BIG GREEN with close below the close of the previous day. Is always a good news. To check. Or follow us to know more.

Testing support and could be bullishRCL is testing support at $101-103 with both horizontal trend line and upward trend line. It could be bullish for the next few months if support is found. Any feedback is appreciated.

RLC-Royal Caribean UpdateIll post the chart to this one. Currently the older chart is attached. But for all intents and purposes, the old one will still work fine. I haven't added or moved any lines.
TL;DW I believe in the lines. I do not believe the price will tank without showing signs ahead of time.

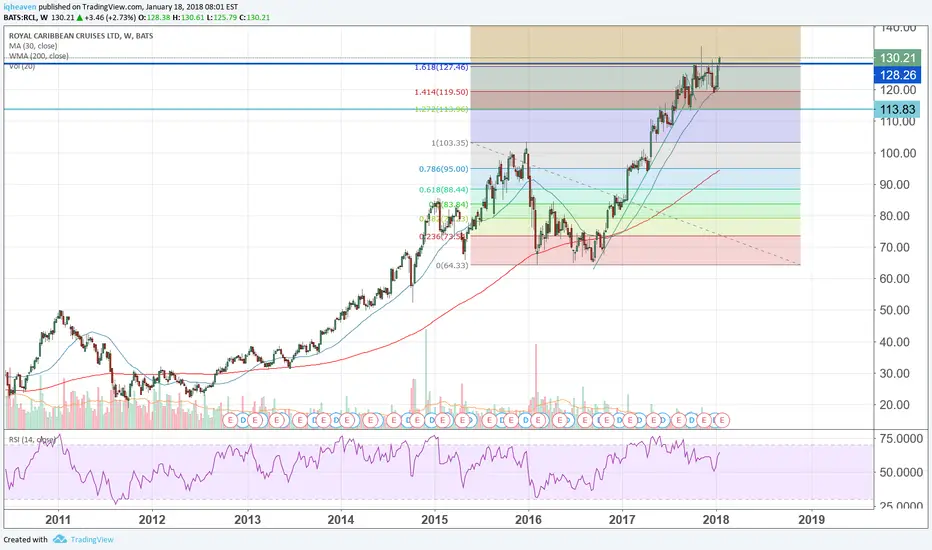
The Sea (Siren) is calling. RCL Royal CaribbeanSo i looked at this because of a family friend that has been holding it. I must say that i have not looked at the fundamentals of RCL and almost do not care, as the ta seems to reflect what is going on before it even happens.
My initial TA was done around May 8th and so far it is moving as expected. I am by no means, saying that news is not important, but it says something when ta alone is enough to tell the movement.
So starting off of that, we see that the 113.00 price point was not even achieved for a movement up and we were shot down around the 109.00 mark.
If TA continues to hold true, I expect RCL to drop to test and fail at 103.00 and drop between 97.70 and 94.64 to find support before a movement back up.
Based on the fib of this last trend (~65.78-134.54) we find the .5 retracal at 100.66
I think it is possible to bounce off of 100.66 and move up slightly, but i ultimately believe we are moving downwards between the yellow downwards trend line and the green support lines. If we assume the 200 ma will find us support, we can also assume that the 200 ma should be around the 94-97 dollar price range, which will add another indicator to convince people to buy in.
Unless something catastrophic happens, I cannot believe the possibility of the price dropping and staying under 83.00
There are simply too many support areas from 3 separate fibs.
I am interested to see how this forms when it hits the coming support levels and I will update my opinion as RCL progresses.
+ten Internets if you got the reference in the title.


RCl Detected possible stock repurchase!!!RCL: royal caribbean cruises ltd
2018-05-09 16:15:16
Detected possible stock repurchase

there will be more cruises for you!this company is trash , if you want to make some cash you can short it and then make $


RCL Confluence at 120Really good looking spot of Support here. Whole Number, 200SMA and a Trendline. Will have to see where it will open at.
Bottom trendline came into play 2015.
Has had a very strong down move with volume the past week hopefully the market can help pull it back up.
Sets up a very nice RR for a bounce back to the top trendline to see if the triangle will continue.
-Risk 119.20
-Entry low 120s
-1st PT 123.50, the dotted trendline was part of a previous longer term trendline that was also about yesterdays high
-2nd PT 126.50 RCL can make a 6 point move and make it to the 9ema50sma
-3rd PT 129 in the next few days if market isnt tanking


RCL Bull Flag PatternRCL just broke out of the bull flag pattern. I'm expecting it to go higher, at least to $27.50, or possibly more. This is my first idea, so any feedback would be appreciated!


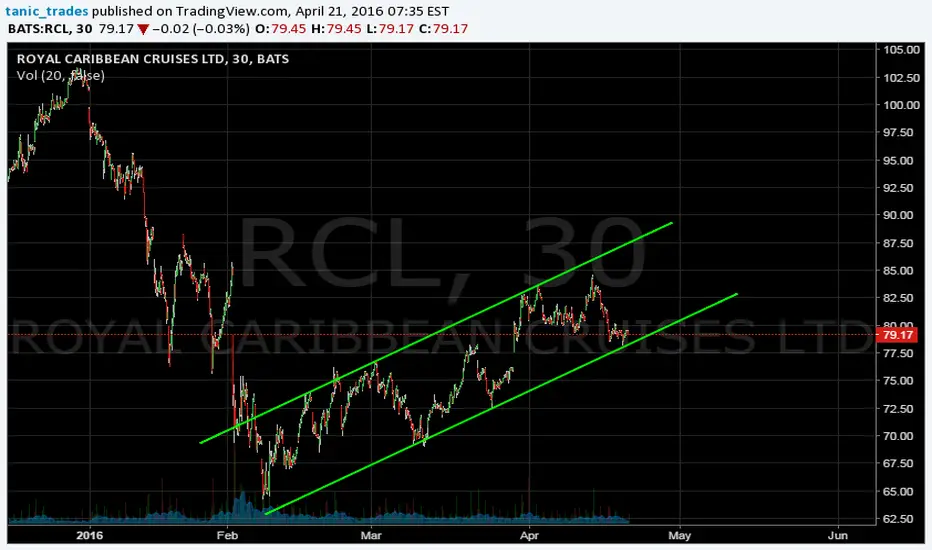
Great fundamentals I like this if we can break 75.10The fundamentals are great, every month the company is becoming more and more important.
Tecnicals only if we break the trend we can go bullish in the long term
long >75.11
SL 73.96
Target 82.69


Head & Shoulders UpdateRCL breaking through all kinds of levels. Terrorism on the rise and consumer is less confident. Shorting to the ground.