Short from down trend and risk off for stocks acc. trade warShort from down trend and risk off for stocks acc. trade war
minimal more to support next move to new low, i expect very low price from troubles this company
RCL trade ideas

RCL - Head and Shoulders, Bearish divergence1. Head and shoulders
2. Bearish MACDH divergence
3. Wave 4 ending

RCLWhen it pull back to soport level its time to get in or if it breaks the resistance then clear for long. I see good opportunity in this company, booking for 2021 is higher than expected already, let´s go Royal


Short RCLCruises are even heavier hit than airlines.
People might be required to take a plane for travel, but certainly not to take a cruise vacation.
Rejected every time it hit its 50D MA, just about to brake support line of around 33.5$.
If this level breaks, there is a lot more room to clear on the downside.
Looking to short with SL at 50D MA.
TP at the YTD low from mid march.

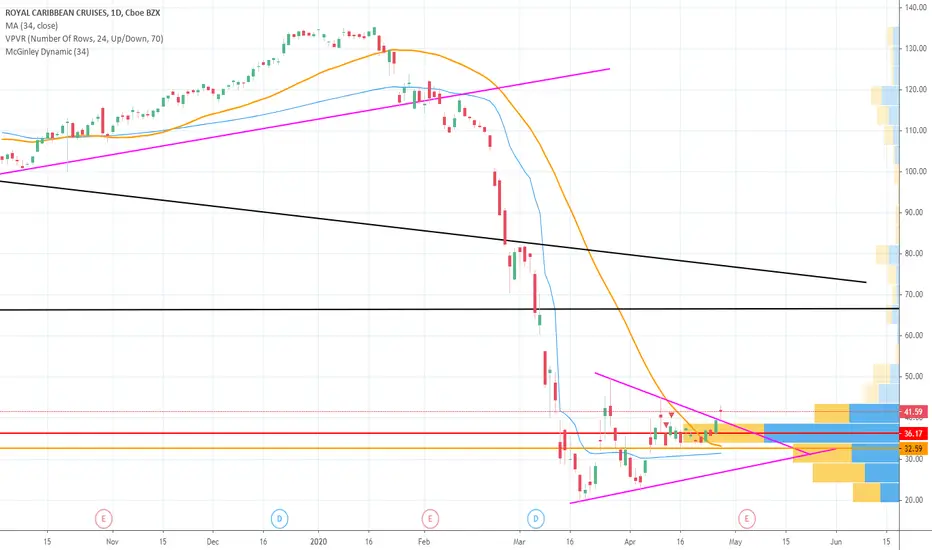
RCL 1D ASCENDING TRIANGLE BREAKOUTAscending Triangles are repeatable trading chart patterns.
Ascending chart patterns will have a directional bias depending on the previous incoming trend.
Each chart pattern will have defining trendlines of the support/resistance levels creating the pattern.
Whatever time frame you are trading this chart pattern, wait for a candle close outside of the trendline in the direction of the breakout candle. (Our time frame preference is the Daily chart).
Add volume indicator - Volume is the amount of $ that went into a particular candle or in Forex the # of trades that took place.
Add ATR indicator - Volatility is the amount of price movement that occurred. Use the ATR to measure the price movement.
When you see descending Volume bars and descending ATR line (which indicates volatility) this shows
a dis-interest in traders to invest in this pair creating consolidation which creates the chart pattern.
Trade Management after there is a breakout candle close.
1 - Position size (compare volume bar to volume ma line).
a - Breakout candle must be 100% of average volume for a full position size.
b - If 75% of average volume then ½ position size. (To find 75% of Volume
look at the charts volume settings – divide smaller # into larger # = 75%+)
2 - Enter two trades.
3 - SL for both trades will be 1.5 x ATR.
4 - 1st trade TP will be 1 x ATR.
5 - No TP on 2nd trade – letting profit run and adjusting SL to follow price.
6 - When 1st TP hit – move 2nd trade SL to breakeven.
7 - Adjust the 2nd trade SL to follow price.
*8 – After Breakout candle – if price closes back into chart pattern close trade
*9 - When breakout candle is more than 1 ATR from breakout candle open.
a - Enter 1st trade at candle close with ½ position size.
b - Enter 2nd trade with a pending limit order that is 1 ATR of breakout candle open.
c – Price should pullback to that pending limit order for 2nd trade.
d – If Price returns back into chart pattern close trade before SL is hit.


RCL new idea check it out...
make sure to subcribe...thats the only way for you to be notified of my new ideas

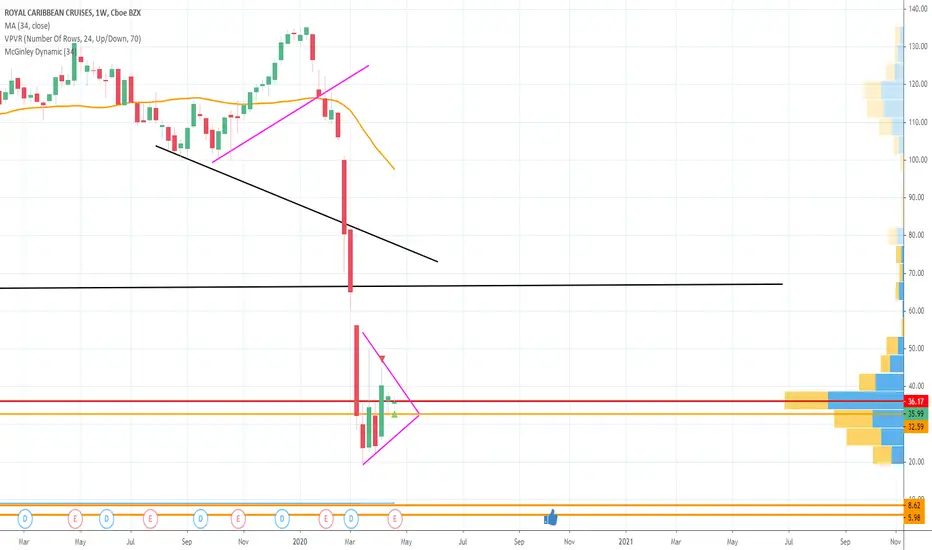
RCL Breakdown?RCL appears to be in a 5.2.1 Regular Flat corrective wave. Clearly you see RCL in BLACK bold, dropped 3 waves, comes up 3 waves, and now I suspect it to drop another hard 5 waves down near Major Support or below.
I do think RCL can maybe make it back to a double top at $42-43, if it can break through resistance @ $37. However, it is very unlikely it does that.
5.2.1 Regular Flat: "A flat correction is a 3 waves corrective move labelled as ABC. Although the labelling is the same, flat differs from zigzag in the subdivision of the wave A. Whereas Zigzag is a 5-3-5 structure, Flat is a 3-3-5 structure. There are three different types of Flats: Regular, Irregular / Expanded, and Running Flats."- elliotwave-forecast

RCL is still looking to break down if you ask metomorrow is their earnings disclosure i think... may be that will hang a punch to the stock... let see...
i am still bearish...


RCL to $7 due to half way patternmany are not ready for this reality just as the oil traders...
Subscribe to learn more fantastic ideas!!!
Follow to be notified of new ideas!!!
Comment to get your thoughts out!!!


RCL broke below previous resistance.I opened short at $35.22. Stop loss at $36.50 Targeting $25ish. Stop loss may be tight. This was sort of an impulse trade.

RCL - End of a bullish trend for now?RCL is bullish on the weekly. However, the daily formed a bearish DOJI on on 09 April, and the 4H charts indicate bearish candles, bearish MACD, and bearish RSI. Also, the price is at the 68% Fib level, which suggests it may retrace to $29.50. Given the COVID-19 crisis and recent CDC "no sail" order (10 April) that will extend into mid-summer, I suspect this will affect the cash flow of NYSE:RCL , NYSE:CCL , and NYSE:NCLH , which may discourage investors next week.
I will go short if the price opens lower than the close on 10 April.

RCL going down to 31.49Rays of peaks and lows show support lines closing in on 31.49. At this point we can expect a breakthrough--unsure up or down
