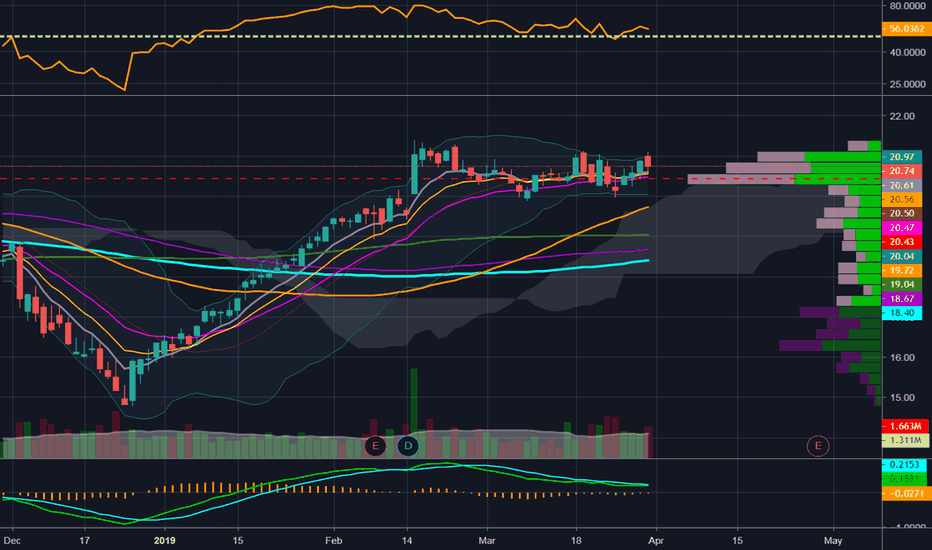
$RDN NYSE:RDN
NYSE:RDN PLAY
To trade RDN (hypothetical stock), you can apply basic rules of Technical Analysis. For example, if RDN is testing support, it may signal a buying opportunity with the target set at resistance. Conversely, if resistance is tested, it could indicate a potential short-selling opportunity with the target set at support. In both cases, the entry point serves as both an entry level and a risk control point.
Swing Trades, Day Trades, and Longer-term Trading Plans:
The data provided can be utilized to create various trading plans for RDN, including Day Trading, Swing Trading, and Long-Term Investing strategies. If you are interested in accessing real-time trading plans, you can explore available resources or services that provide such plans.
Longer-Term Trading Plans for RDN:
- Buy RDN slightly above 23.92 with a target of 26.22 and a stop-loss at 23.85.
- Short RDN slightly below 26.22 with a target of 23.92 and a stop-loss at 26.3.
Swing Trading Plans for RDN:
- Buy RDN slightly above 25.84 with a target of 26.22 and a stop-loss at 25.77.
- Short RDN slightly near 25.84 with a target of 25.13 and a stop-loss at 25.91.
Day Trading Plans for RDN:
- Buy RDN slightly above 25.87 with a target of 26.22 and a stop-loss at 25.81.
- Short RDN slightly near 25.87 with a target of 25.13 and a stop-loss at 25.93.
RDN Technical Summary | Raw Data for the Trading Plans:
Term | Near | Mid | Long
Bias | Neutral | Neutral | Strong
P1 | 0 | 0 | 21.62
P2 | 25.87 | 25.13 | 23.92
P3 | 26.11 | 25.84 | 26.22
Please remember that trading decisions should be made based on comprehensive analysis, real-time data, and your own risk tolerance. It is advisable to consult with a financial professional or utilize reputable trading platforms for accurate and up-to-date information before making any investment decisions.
RDN trade ideas
Potential Radian Group Trade In Either DirectionRadian Group (RDN) is sitting right on a support line that was established on a daily chart . This price level was resistance in June, resistance again in early and mid November, and held as support for three days last week. Radian has been in an up trend recently. We saw some dark pool activity in this area, as well as some options flow. The options flow wasn't super aggressive, but it was for May expiration, so plenty of time on those contracts.
What I like about charts like this is that we don't have to guess at what trade to take. Since we are sitting right on a sup/res line, if we open above this line, we can take a long position, with a stop slightly below. If we open below this level, we can take a short position with a stop slightly above. Since we are sitting right on a sup/res line, we will know right away if our trade idea is invalidated and we can exit with minimal losses. This one is on watch for Monday's open to see which direction it opens and what kind of strength or weakness it shows.


