DRREDDY GO FOR BUY DRREDDY LOOKING STRONG BUT RIGHT NOW ITS JUST WENT OUT FROM THE WEDGE ACCORDING TO ME ONCE IT WILL COME TO MY LEVEL AND WILL ACTIVATE MY BID AND THEN IT WILL START RISE AGAIN HERE ALSO I AM LOOKING FOR 10:1 REWARD TO RISK RATION ANYWAYS IF MARKET WILL NOT COME TO MY LEVEL AND IF MARKET BREAK TODAY'S HIGH THEN CANCEL YOUR BID OTHERWISE WAIT FOR PASS MY BID
RDY trade ideas


Drreddy - Elliott wave analysis - 5th wave up Drreddy has completed 1st wave as leading diagonal and it may be in 3rd wave up, so go long for target above 5600 or higher level.


R-0231 Short Term Cash Buy DRREDDY @5070-5075 SL 4945 TGT 5300Short Term Cash Buy DRREDDY @5070.00-5075 SL 4945 TGT 5300 (Bullish breakout post consolidation)
The stock price is 1% lower from intraday high so good entry level.
Break resistance 5011 and 5006 on daily and hourly chart so chart looks bullish. Next resistance level 5200/5395 we expect it to break 5200 and move towards 5395.
Close to VWAP 5054 once hold can see intraday sudden movement on the upside.
TK line cross over again add favourable for the buyer.
Once I am publishing it moves 0.5% so looks in good momentum.

Drreddy - Elliott wave analysis - 5th wave up Drreddy is moving as expected earlier. Go long with stop level below 4807 for target above 5600 in small pull back.


DR Reddy has formed the Symmetric training pattern it has given DR Reddy has formed the Symmetric training pattern it has given the break on day candle.
Target And Stop loss are updated in the chart


Drreddy - Elliott wave analysis - 5th wave up Drreddy is in 5th wave up in bigger time frame as expected earlier. The 3rd wave up is in progress. wait for pull back to get in to trade near 4900 zone with stop loss below 4657 for the target above 5600 or higher high.

DRREDDY - why so slow?Are you waiting for some movement for DRREDDY?
Here is an echo from the time cycle, and we are bullish for 10th Dec (plus minus one day).
Thank You

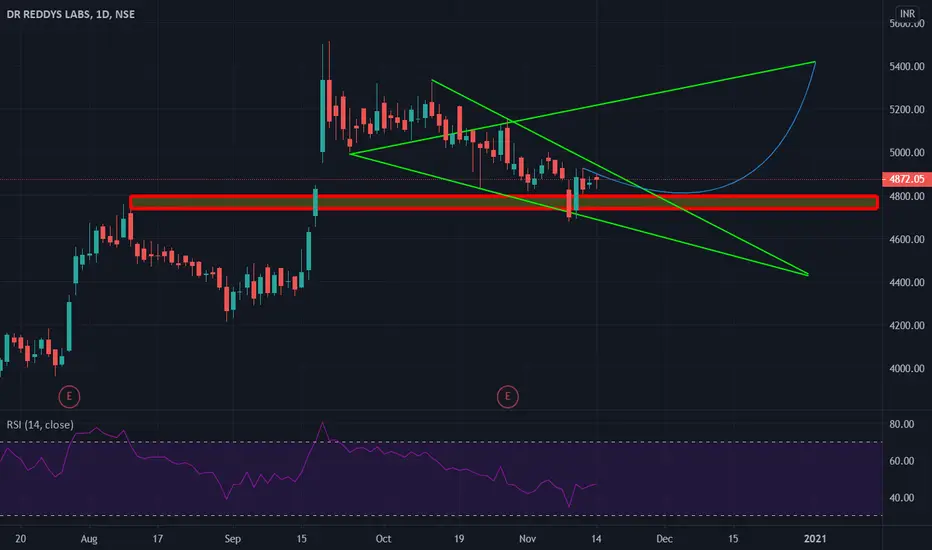
Drreddy - Roundling BottomDrreddy retraced at golden ratio and forming round bottom. on verge of breaking neckline, RSI just crossed 60. Showing a powerfull momentum. Targets on chart...


Drreddy - Elliott wave analysis - 5th wave up Drreddy is in 5th wave up. Go long near 4800 or slight lower level with stop loss below 4654 level for target above 5550 level. This is very good swing trade.


Dr Reddy - Ready for Breakout Above 4875Dr Reddy had a breakdown from the flag pattern it formed after huge upwards movement and filled and the gap and also consolidated in the range.
Last three closing have respected 9 DEMA and a closing above 4875 would mean respect for 21 DEMA also.
The stock shall take significant upmove on closing above 4875.


DRREADY IS IN BULLISH WOLFE WAVE CMP 4735 FOR 4958/5110/5745DRREADY IS IN BULLISH WOLFE WAVE CMP 4735 FOR 4958/5110/5320/5475 VIEW INVALID BELOW 4550
Comment: 4886 FROM 4735
Dr Reddy [Pharma Play]Stock has has been correcting for a while.
Nifty Pharma has also been correcting and could show rebound anytime soon.
Stock has taken strong support at 4800-4850 levels and has given a rebound as well.
Good time to start accumulating the stock.
MACD is has also given sign for reversal.
1st Target: 5330
2nd Target: 5500
SL@4700

DR REDDY LOOK OUT FOR THESE LEVELS!!! ALL THE LEVELS AND PATTERNS ARE MARKED ON CHART, RED ZONES DENOTES SUPPLY ZONES AND GREEN IS FOR DEMAND ZONE .
4980-4965 CAN ACT AS GOOD RESISTANCE; SELL ONLY IF THERE IS A REVERSAL CANDLE
The indicator used:
1) Daily Lines plots Daily 20 (BLACK) & 50 EMA (GREY) on lower time frame charts
2) TE-REKAB
- PB : PULLBACK
If you like the analysis, do leave a like and follow for more such content coming up.
The analysis is my POV, hope you got bucks in your pocket to consult a financial advisor before investing :P :)
HAPPY TRADING!

DRREDDY (BULLISH SWING)NSE:DRREDDY Daily Chart
This is DRREDDY daily chart
It is forming a Bullish Descending triangle pattern
Buy it on the breakout level of 4850
for the target of 5055,5260,and for the further target of 5512
Trade with Proper Risk Management.
Victory is beyond fear!!
Disclaimer: I am not a SEBI Registered Analyst. Please take position after consulting your advisor.
