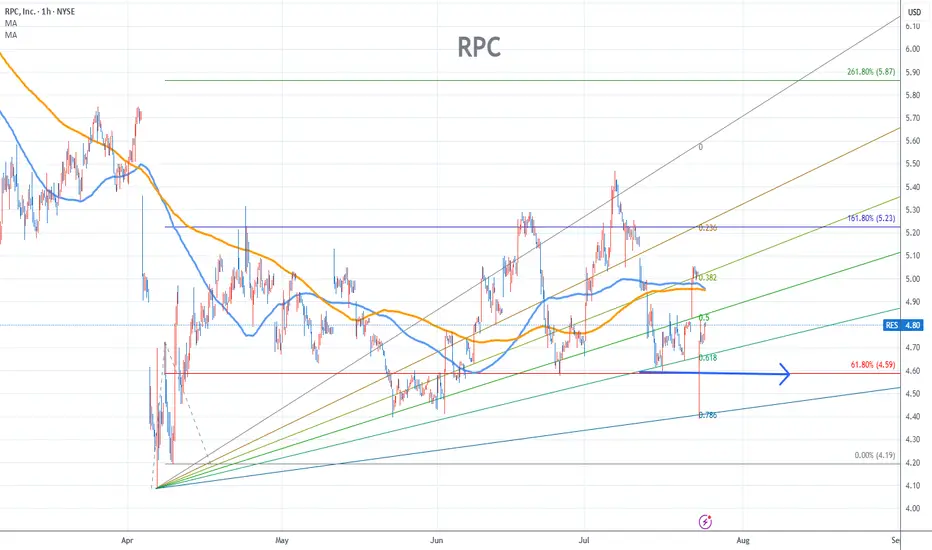
RPC Stock Chart Fibonacci Analysis 072425Trading Idea
1) Find a FIBO slingshot
2) Check FIBO 61.80% level
3) Entry Point > 4.6/61.80%
Chart time frame:B
A) 15 min(1W-3M)
B) 1 hr(3M-6M)
C) 4 hr(6M-1year)
D) 1 day(1-3years)
Stock progress:A
A) Keep rising over 61.80% resistance
B) 61.80% resistance
C) 61.80% support
D) Hit the bottom
E) Hit the top
Stocks rise as they rise from support and fall from resistance. Our goal is to find a low support point and enter. It can be referred to as buying at the pullback point. The pullback point can be found with a Fibonacci extension of 61.80%. This is a step to find entry level. 1) Find a triangle (Fibonacci Speed Fan Line) that connects the high (resistance) and low (support) points of the stock in progress, where it is continuously expressed as a Slingshot, 2) and create a Fibonacci extension level for the first rising wave from the start point of slingshot pattern.
When the current price goes over 61.80% level , that can be a good entry point, especially if the SMA 100 and 200 curves are gathered together at 61.80%, it is a very good entry point.
As a great help, tradingview provides these Fibonacci speed fan lines and extension levels with ease. So if you use the Fibonacci fan line, the extension level, and the SMA 100/200 curve well, you can find an entry point for the stock market. At least you have to enter at this low point to avoid trading failure, and if you are skilled at entering this low point, with fibonacci6180 technique, your reading skill to chart will be greatly improved.
If you want to do day trading, please set the time frame to 5 minutes or 15 minutes, and you will see many of the low point of rising stocks.
If want to prefer long term range trading, you can set the time frame to 1 hr or 1 day.
RES trade ideas
RES neutral patternRES is inside the pennant which is a neutral pattern.
Our strategy is to wait for a breakout and then take a position.
Targets both for longs and shorts are shown on the chart.
Good luck.

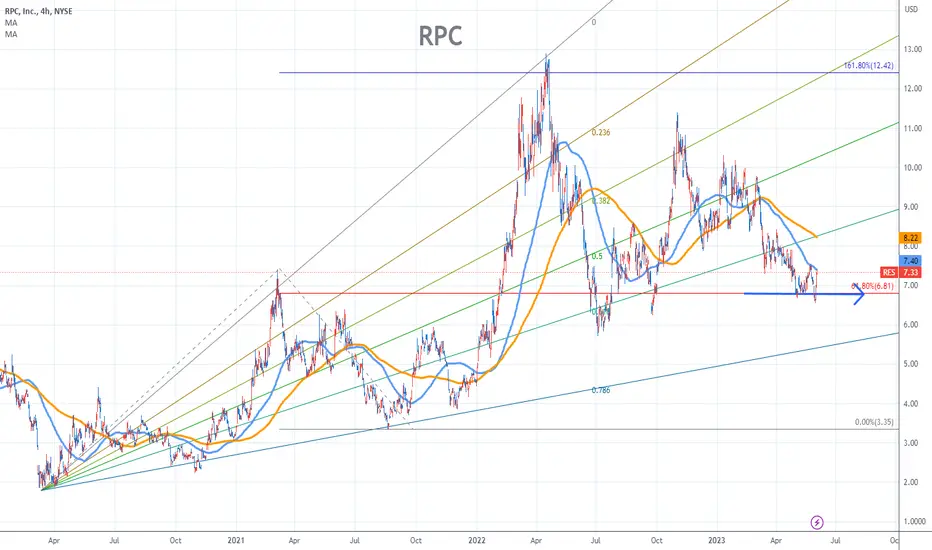
RPC Stock Chart Fibonacci Analysis 060423 Trading idea - Entry point > 6.8/61.80%
Chart time frame : C
A) 15 min(1W-3M)
B) 1 hr(3M-6M)
C) 4 hr(6M-1year)
D) 1 day(1-3years)
Stock progress : 1
A) Keep rising
B) Hit the bottom
C) Hit the top
Stocks rise as they rise from support and fall from resistance. Our goal is to find a low support point and enter. It can be referred to as buying at the pullback point. The pullback point can be found with a Fibonacci extension of 61.80%. This is a step to find entry level. 1) Find a triangle (Fibonacci Speed Fan Line) that connects the high (resistance) and low (support) points of the stock in progress, where it is continuously expressed as a Slingshot, 2) and create a Fibonacci extension level for the first rising wave from the start point of slingshot pattern.
When the current price goes over 61.80% level , that can be a good entry point, especially if the SMA 100 and 200 curves are gathered together at 61.80%, it is a very good entry point.
Brilliantly, tradingview offers these Fibonacci speed fan lines and extension levels with ease. So if you use the Fibonacci fan line, the extension level, and the SMA 100/200 curve well, you can find an entry point for the stock market. At least you have to enter at this low point to avoid trading failure, and if you are skilled at entering this low point, with fibonacci6180 technique, your reading skill to chart will be greatly improved.
If you want to do day trading, please set the time frame to 5 minutes or 15 minutes, and you will see many of the low point of rising stocks.
If want to prefer long term range trading, you can set the time frame to 1 hr or 1 day.
RESPossibly seeing a fake breakdown?
I entered long today and am interested in the volatility that gas/oil names have. Only in commons. Expect 13-14$

nice breakout 💸RES breaking past extreme resistance after the retest bounce. very bullish!
the next targets are 13.24-14.4

Don't be silly! 🎅Hi everyone, Yurii Domaranskyi here. Let's take a look at the chart:
1. Price levels are working pretty well!
2. globally down trend locally uptrend
3. the level confirmed by 2 false breakouts
4. distant test
5. approached with big bars
6. there was a sharp approach on m5
7. no rollback
8. from that level continued strong move down
9. enough room for a move 1 to 5.1
10. the price came from below
11. no news for the last 10 days
12. no report in the following 2 weeks
Potential risk/reward ratio = 1 to 5.1 meaning that potential risk 100$ with the possibility to make 510$
If it does make sense to you, press a thumb up! 👍

Nice 3:1 trade on the daily chart with an uptrending stock.Price is trending upwards. It has been retracing up to the 70% Fib level for the last several swings. Go long when price takes support on the trend line near the $5.18 price point, stop loss near $3.68, and take profit near $10.25 at a strong resistance level as seen on the monthly chart.

3 Hr. "INVERSE HEAD & SHOULDERS" BULLISH
Classic Inverse Head & Shoulders bullish idea.
Enter long at green(you can enter at first green line or second green line), exit for loss at red or exit for gain orange lines(you can exit at either orange line).
DISCLAIMER:
I'M NOT A PROFESSIONAL TRADER AND THIS IS NOT A TRADING ADVICE.

RESMID-TERM: Bullish gartley AND bullish crab potentially double bottoming at the same PCZ level, which is a historical area. Daily classic bullish divergence on the RSI. (not financial advice)

RES: LongRES is in a multi-month rising channel.
Broke a smaller falling channel after testing the multi-month rising channel.
- Also broke through 50MA
In the next few days the price will test $5.36 resistance.
The price needs to flip the $5.36 resistance to support, if failed to flip price will likely roll and retest multi-month rising channel.
- 50MA also being tested as support/resistance. Closed above 50MA, can it hold?.... TBD
Target: $7.50
Stop Loss: $4.43

US Stock In Play: $RES (RPC Inc)$RES rallied a further +3.99% to close at $6.77, putting it on a spotlight for a second re-test of its resistance turned support at $6.80 range that was highlighted previously. Wednesday’s closing affirms a higher angular (in momentum) trendline support for $RES, putting it in traction to re-test its Month’s high closing of $7.16 that was established during the opening of the week. The total cumulative rally from the breakout of its 3 months trend channel stance at +49.94% in 28 trading sessions.
Implied volatility of $RES have witnessed an increment to $0.45/day, a 28% increase in volatility of price action in 2 weeks. The breakout of $7.45 resistance will smoothly play out a long term trend reversal for $RES, confluence with a major MAs golden cross, with next significant levels to watch at $10.
$RES provides a range of oilfield services and equipment for the oil and gas companies involved in the exploration, production, and development of oil and gas properties.

RES: Bullish FlagBullish Flag
Pros:
Volume during post forming
Descending volume during flag formation
Golden cross in blue
PPS above 50MA and 200MA
RS above 0, and ascending
ATR Ascending
R/R ratio above 5
250RSI above 50
200MA ascending
Target:
PT = 6.82$
Help how ever you can to keep this alive.
Thank you to those who have donated Coins!
Stay Humble, have fun, make money!


US Stock In Play: $RES (RPC Inc)With $SPX suffering a further correction of -2.6% as investors begins to worry about rising yields where the benchmark 10-year U.S. Treasury note briefly crossed the 1.6% level, $RES rallied a further +8.31% to close at it’s 52-weeks high at $6.39. The total cumulative rally from the breakout of its 3 months trend channel stance at +39.33% in less than 19 trading sessions.
Implied volatility of $RES currently averages at $0.35/day, putting it on a spotlight to re-test its immediate resistance level at $6.80 in the upcoming session. Any signs of exhaustion will required $RES to break below $5.00 before End March 2021.
$RES provides a range of oilfield services and equipment for the oil and gas companies involved in the exploration, production, and development of oil and gas properties.

RPC, Inc. (RES) long.All description on the chart.
Please, don't forget to like and follow.
Thank you.

RESNice wedge formed higher lows testing resistance. Definitely add to watchlist and watch. Trade it when you see it.

RES Gann ProjectionUse the low of .04982 ; use the high of .92756 & project out from there and these critical levels present themselves
acknowledge the strength of these gann levels
manage your own risk
gl hf
xoxo
snoop

RPC INC (RES) - Long +30% profitI'm longing @ approximately 9.71 with a long term target of at least 13.00
Tight stops.
Arguments:
1. Expanding diagonal identified (zoom out).
2. fib relations are respected in individual ABC waves.
3. 5th bearish Elliott wave withing wave C soon completed. (minor EW 1-5 as shown on chart)
4. Bullish divergence noted on the RSI charts
5. Volume and price action showing oversold status
6. MACD 4HR chart is showing promising signs of a reversal point approaching.
7. GAPS above need to get filled. (92% of all gaps in the markets get filled)

RES: WIll get out of this trade..this is bad looking setupPossible down fall but in a long run (2yrs may be) this can pay big.

$RES unusual activity in RPC INCThis stock was brought to our attention by the unusual volume and option activity in the stock on 04/04/19 which also coincided with a very rare upgrade for the stock to $15, we will be taking a position if trend line broken on good volume.

RESWrite sometning about your psyhology thinking before trade? i am ok i was sleep in the afthernoon
Describe the trade. What you see? it is a wedge forming so price will go from one side of support to the other side of resistance in between I will make money
What have I done well for this trade? you recognise the triangle pattern and act according to teory and try to get somthing in between support and resistance
What can I take away to help with later trades? that be carefull on little movement in price especialy in lower low is slitly different.

RES Detected possible stock repurchase!!!RES: rpc inc
2018-04-02 16:30:06
Detected possible stock repurchase

Is Major Trend in-between 30 to 45 degrees?On 1 hr and higher charts you can tell if TREND is to fast (over 45 degrees) or to slow (less then 30 degrees) or just right to continue in major direction. These also play great Support and Resistance areas on any trends and gives you a heads up on change of trend too. I would wait to short this stock (if traded) until 50 % retracement on Fib. Ret on chart, which is around $22.30. Also you could write put options underneath price action, at say $16.00 if you don't mind owning this stock at $16 x 100 = $1,600 (when you do options, you need to always buy options in LOTS of 100). Enjoy trading it is organized kayos.
