RKT trade ideas

Misery likes a good companyI bought into the RKT hype like many others ... and it's been miserable in almost every way. My ugliest active chart, and it's not even close. Still, there seems to be a lot of long-term excitement about this stock, the company is solid, the outlook for mortgages is less dire than some make it out to be, so while I wouldn't short it, I'd wait to see if it can hold/bounce off that POC in the low 19s before even considering adding to my position.


2nd cup with handle pattern?Fairly new to the game. Looking at the chart it may be forming a second cup with handle. hopefully we see it play out, but this is definitely a long term minvestment.

Not rektShould have listened:
old.reddit.com
Contemplating dumping my stagnant $WMG position for a small loss to take part in what seems to be the main event.

Rockets are built to go to the moonThe chart shows us a f#&cked-up " Cup and Handle" pattern.
It might take off soon but wait for the confirmation.
Hope, this analysis was helpful for you

Potential bottom? Trend Reversal? Greetings.
I'm bullish on RKT and currently have a LONG position in the stock. I notice there is divergence between the Volume Weighted Moving Average ( VWMA ) and the Exponential Moving Average ( EMA ), both of which are configured to measure 14 days of price action in this daily chart . I interpret this divergence as bullish and a potential signal to an emerging upside trend for the following reasons:
1. VWMA measures (closing price + volume ), while EMA measures (closing price only). VWMA emphasizes volume , and volume is a key indicator of the (strength) of a trend. Currently, volume is decreasing, while price is making higher highs, hence the rising VMWA. In contrast, the EMA is only measuring the average closing price of RKT in the last 14 days (3 weeks), and indicates that RKT is trending down, which is obvious to the naked eye. I interpret the decreasing volume as weaknesses in the current down trend, and the rising VWMA as a signal of a potential reversal.
2. RKT formed a bullish cup & handle signal in the month of August and hit resistance on 2 Sep at 34.41 before retracing nearly 35% to the current price. Based on the 1:1 minimum price target ratio theory, I anticipate a long-term minimum target price of $42, based on the C&H pattern.
3. Volume is decreasing while price is moving sideways, which indicates a period of consolidation, before a new trend begins - either to the upside, or to the downside.
4. On 2 Sep, RKT beat earnings by 2304%, which I interpret as strong fundamentals for a company that just IPO'd o/a 06-Aug.
If price breaks and closes above the 14-day EMA with strong volume acting as confirmation, then I interpret this as a LONG signal with an initial target of $28. Of course, I could be completely wrong on this idea, because I'm no professional, and markets are irrational at times. 😎
Happy Trading!
Disclaimer. My ideas are for informational purposes only. My ideas do not constitute solicitation, recommendation, endorsement, or offer to buy or sell any securities or other financial instruments. You should not construe any such information or other comments as legal, tax, investment, financial, or other advice. There are risks associated with investing in securities. Investing in stocks, bonds, exchange traded funds, mutual funds, options and money market funds involve risk of loss. Loss of principal is possible. Please exercise your own due diligence.

RKT 9/11: Resistance held through Low VolumeRKT has performed better than SPY during the large TECH sell off

RKT 9/9: Needs to Break 25.80 RESISTANCE LEVELRKT stock was brought down recently along SPY with the Tech Sell off. If Green Futures and DAX Bulls continue RKT could break out beating SPY.

RKT - Support and Resistance Levelssmall recovery today - price between the GPs of the lower channel

Good entry pointMy plan is to set a limit buy to 21.61
This particular stock is promising both Fundamental and Technical.
And they actually had a good earnings report.

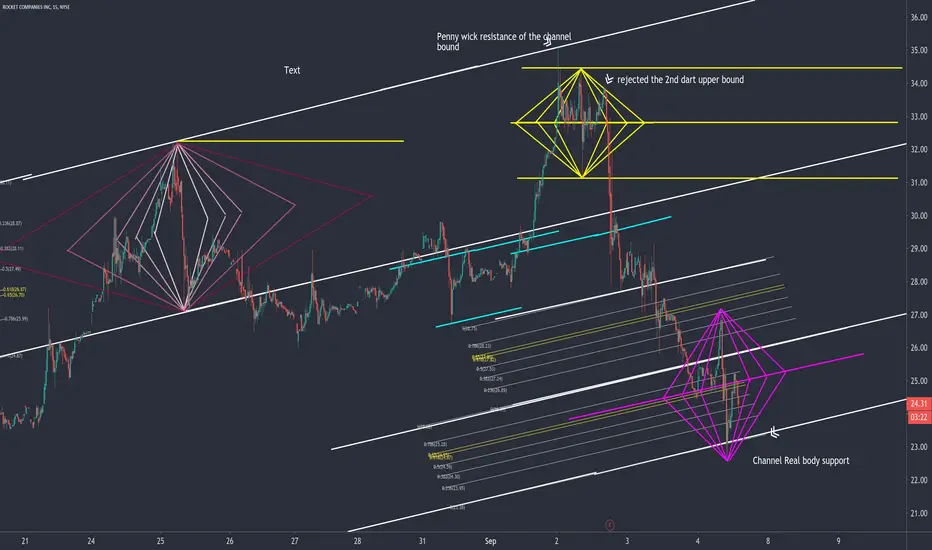
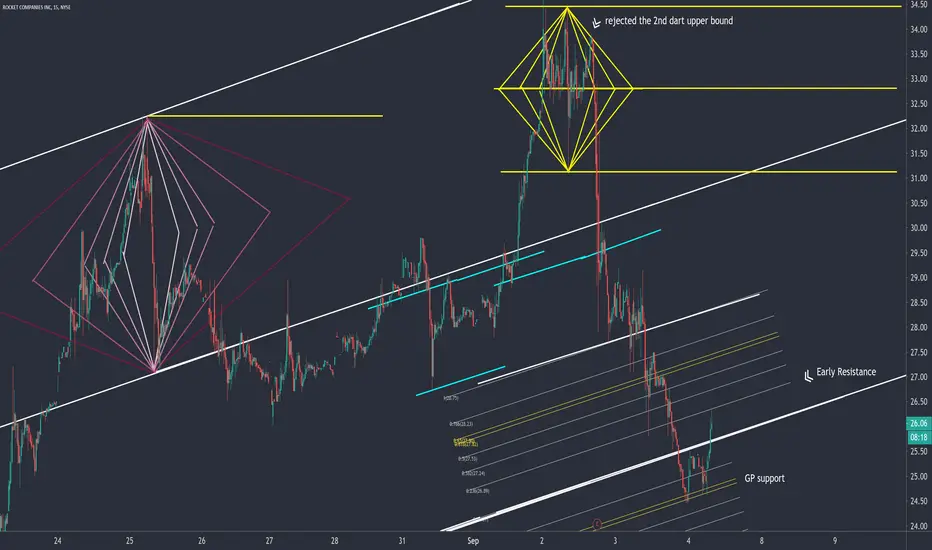
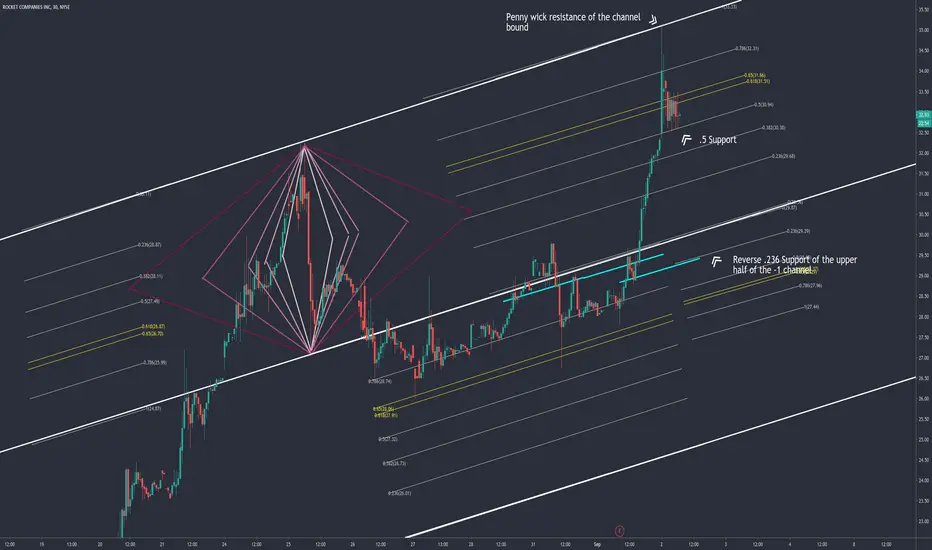
RKT - printed a text book diamondtough play even when on the look out for them. The squeeze looked like it was a go in the pre-market - then the diamond drop..
Rocket #RKT $RKT AnalysisRocket had an exceptional earnings report that blew expectations out the water. Although earnings went well, Price did come down, but as you can see. Primarily it came down to fill the gap highlighted in the purple box. My Bias on #RKT is going Long.

RKT - when will the squeeze occurIf you are short are you looking for more downside. Bull plays need the market to find support and break and backtest this GP

RKT Retest BounceRKT has retested support levels of $27. It has retraced from its breakout back to now support, which is a typical move. Now we can play the bounce back upward to the 29-30 range.

Cup and Handle. Bullish. Target: $42Greetings.
I'm bullish on RKT largely based upon the C&H formation, which is a bullish formation. RKT IPO'd last month, so there isn't enough historical data to determine if this is truly a bullish trend. I'm naturally optimistic and therefore have a bullish bias.
Happy Trading!
Disclaimer. My ideas are for informational purposes only. My ideas do not constitute solicitation, recommendation, endorsement, or offer to buy or sell any securities or other financial instruments. You should not construe any such information or other comments as legal, tax, investment, financial, or other advice. There are risks associated with investing in securities. Investing in stocks, bonds, exchange traded funds, mutual funds, options and money market funds involve risk of loss. Loss of principal is possible. Please exercise your own due diligence.

RKT , nice earnings beat today (Sept 2nd)Reported Q2 revenue today of 5.04 Billion and the consensus estimate was 3.75 Billion , that is a big difference. Then oddly enough, after this there was a fairly significant drop in the share price after hours, to which I could not find the reason for. Having said that, I personally have learned not to play earnings as you can have all the reasons in the world for a company to rally and the exact opposite can happen, sometimes for very little reason .
I have done my research into this recent IPO and I really like it. I am short on time to do a more detailed write up that RKT deserves but I am a fan of the stock. Wanted to mention it quickly and leave the additional research up to the reader . Great longer term hold with a discounted price imo.

RKT - back to supportbig beat on earnings, will see if this is just a bump in the road. Market continues to melt-up, RKT needs one day of price discovery and we should know how the street sees it.

BUY RKT BEFORE EARNINGSreally like the rocket setup. no idea what the company does but there's a lot of hype, we have a nice dip, and earnings are coming up. a little bit of a gamble but I definitely like it with Cramer and Portnoy and WSB autists all pumping it.

RKT, 9/1: 15% growth Pre-EarningsToday we saw a dive after steady pre-market climbs. volume was initially low and grew throughout the trading day. After the bell there was a dip and then bullish sentiment with higher volume.
Target: $33 EOW
