diamond shaped moving into a breakthrough areaConsolidation and sideways movement, with oscillators not yet convinced the move is over, could be the start of a higher move.
RSG trade ideas

RSG ShortRepublic Services, Inc. (RSG) has formed a topping candle on the daily chart, indicating a potential mean reversion trade for a correction lower. The setup involves entering at the low of the day (LOD) with a stop loss at the high of the day (HOD), targeting the anchored VWAP from earnings around $188.23. This trade hinges on the idea that a new all-time high (ATH) signals an invalid setup. The recent 4-day candlestick pattern with gaps adds uncertainty, making it a speculative but potentially profitable trade if the correction materializes.

RSG - fall -16.23% to $1.29 per share on February 27The last earnings report on September 30 showed earnings per share of $1.54, beating the estimate of $1.43. P/B Ratio (5.634) is normal, around the industry mean (4.741). P/E Ratio (35.849) is within average values for comparable stocks, (45.795). RSG's Projected Growth (PEG Ratio) (3.230) is slightly higher than the industry average of (2.225). Dividend Yield (0.011) settles around the average of (0.031) among similar stocks. P/S Ratio (3.994) is also within normal values, averaging (104.394). With 1.07M shares outstanding, the current market capitalization sits at 58.20B.

RSG - Double Symmetrical TrianglesTwo Symmetrical triangles in succession
The first being a lot smaller than the second
The second also yet to break out fully

$RSG with a Bullish outlook following its earnings #Stocks The PEAD projected a Bullish outlook for $RSG after a Positive Under reaction following its earnings release placing the stock in drift A with an expected accuracy of 77.78%.


RSG SWINGRepublic Services, Inc is the second largest provider of non-hazardous solid waste collection, transfer, disposal, recycling, and energy services in the United States, as measured by revenue.

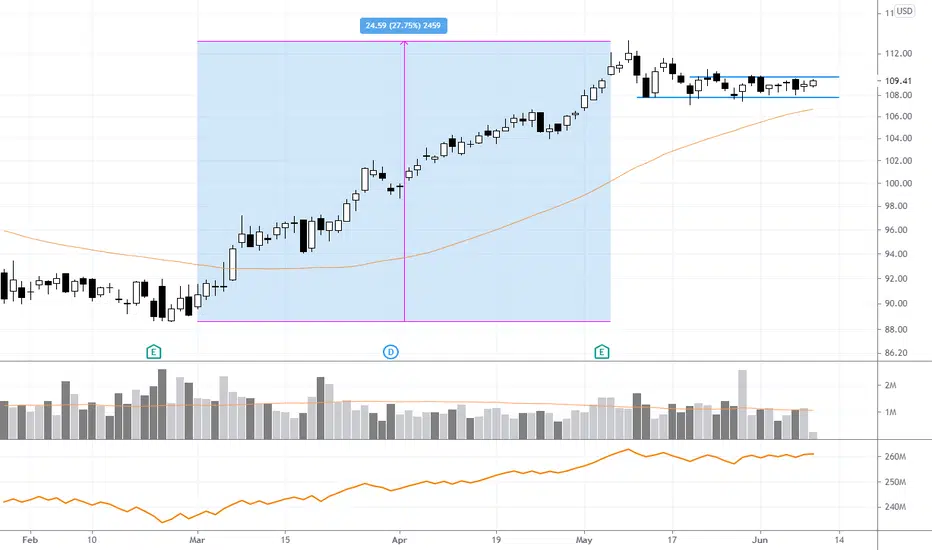
$RSG Box SetupUp 27+% in the last few weeks and now basing on its 50 MA with a very tight box setup. Watch for 1st sign of momentum to kick in the next leg higher.
Republic Services Inc (RSG)- PROVIDES NON-HAZARDOUS SOLID WASTE COLLECTION SERVICES FOR COMMERCIAL, INDUSTRIAL, MUNICIPAL AND RESIDENTIAL


REPUBLIC SERVICES Strategy DailyHello traders, REPUBLIC SERVICES is in a fake bearish configuration with a large volume of buying made and a trail of sellers. On the TIMEFRAME M1 we can see a rejection of the sellers followed by a panic, it goes to its last low to return to its price increase. Great likelihood of going to the next high (See TIMEFRAME H4) and if the buyers are still in the game manage to fill the bearish breakout gap. For arrival on the next high between significant resistance on the TIMEFRAME H1.
Please LIKE & FOLLOW, thank you!


IdeaShort position to begin with, depending on economic factors, etc.I personally used to work for this company in the past before I got in the markets and this companies stock has got me pretty intrigued with the innovation they are having in the waste disposal industry. Main target 94.85. Will re assess if there are any prices in structure and price developments.

RSGSystem T Performances: Annual Compound Profit 40%, Win Rate 55%, Risk/Reward Ratio 1:2, 20 Years of Backtesting Data, Over 100 Markets.
* Click Like and Follow to Support My Work!
---
Hi Traders,
I'd like to introduce the System T, a computerized trading system that analyzed and backtested the 20 years history data of over 100 markets.
This post is my sharing of how I think about systematic trading and the signals generated by the System T.
(This is my opinion only, NOT the financial advice.)
I think that for the system to open a trade and manage risk, it only needs a buy signal & a stop-loss signal clearly on the chart.
Once the system finds a good trend, it will ride it as long as possible. The stop-loss will be adjusted accordingly to the new price movement.
(Remember to follow this trade idea and follow my profile to get updates about the stop-loss adjustment and sell signal based on the latest price and market conditions daily.)
System T performances above will give you an idea of how it performs in the last 20 years.
Notice that this result was achieved only if I strictly followed the rule: "Only and Always Buy & Sell based on the System Signals".
Don't sell when there is no sell signal as we all want to follow the good trends til the end like everything in life does. \(^-^)/
Also, my system is extremely diversified through over 100 markets so that it only risks less than -1% of the total capital per trade.
Thank you and good luck!
---
DISCLAIMER:
I am NOT a financial advisor, and nothing I say is meant to be a recommendation to buy or sell any financial instrument.
My views are general in nature and I am not giving financial advice. You should not take my opinion as financial advice. This is my opinion only.
Do your own due diligence, and take 100% responsibility for your financial decisions.
Trading and investing are risky! Don't invest money you can't afford to lose, because many traders and investors lose money. There are no guarantees or certainties in trading.
- Content is for education purposes only, not investment advice.
- Trading involves a high degree of risk.
- We’re not investment or trading advisers.
- Nothing we say is a recommendation to buy or sell anything.
- There are no guarantees or certainties in trading.
- Many traders lose money. Don’t trade with money you can’t afford to lose.

Structural Trend Remains!RSG broke out of an upward wedge formation back in 2014. Fibonacci advancements have proven correct so far. RSG recently reported solid earning while also increasing the dividend by 8%. RSG is also focusing on converting customers over to a 3% or better price adjustment contracts. The Trend Is your Friend! Focusing on the technical as well as positive fundamental picture here is important.
Discounting Cash Flows with a relative 4% Growth Rate indicates an Intrinsic Value Buy price of $47 and a Sell price of $121.


buy RSGBuy order, good ratio. we will see. The aim is to increase the SL according parallely to the support

Waste Bin: RSGHowdy Yall!
I'm definitely up to something now... Haha! This is one of my favorites, keep an eye on it... we're very near to being able to jump into RSG! There is a longer write-up on the way, you can be sure of it! We're looking at creating a new basket; prepared for an economic downturn!


$RSG beginning of a new multi week bullish trend$RSG is showing all the signs of the beginning of a new multi week trend
1) Weekly break out of a consolidation level has held for 2 weeks, indicating that this is unlikely to be a false break
2) ADX has begun to rise very sharply. Some of the most powerful trends start at a base of the low teens then jump suddenly to the high teens in a matter of a couple of bars. This is perhaps the most powerful use of the ADX for gauging what is likely to be the beginning of a new trend (i.e. how quickly it rises from a low). Because RSG has been in a sideways consolidation for so long the potential is very large.
3) RSI is not even overbought yet indicating that this is really the ideal time to hop into what could be a very long trend.
4) A close above the $42.50's is a weekly record print
5) Closing above upper bollinger for the third week in a row
DYOR as always
