When the world arms up... some stocks quietly load too. “💣📊
RTX ( NYSE:RTX ) just bounced off a rising trendline 📈 and broke through a tight range — like a stealth drone ready to strike 🎯
In a time where every headline smells of conflict 🌍⚔️, defense names like RTX aren't just charts... they're chess pieces on the global board. ♟️
This triangle breakout isn’t random. It’s calculated.
📌 Trade Details:
Entry: $146.68
Target: $149.42 – $150 🚀
Stop-loss: Below trendline (tight risk)
In war-driven markets, silence doesn’t mean peace — it means preparation.
Are you watching the defense breakout... or will it fly under your radar? 🛸
#RTX #DefenseStocks #GeopoliticalMoves #BreakoutTrade #StockWatch #TradingSetup #Raytheon #TradingView #WarStocks
RTX trade ideas

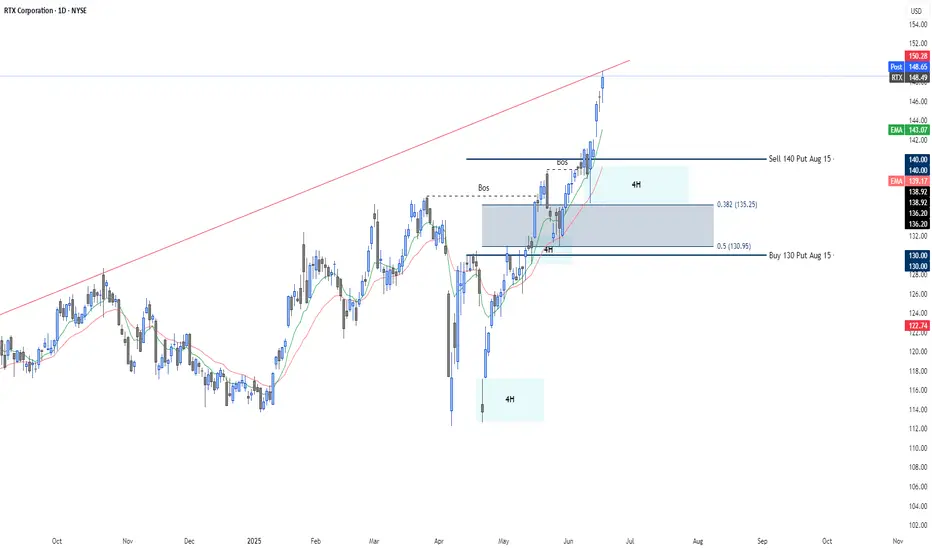
RTX – Defense sector strength backed by structurePut Credit Spread Aug 140/130 | Entry: -1.81 | POP 76%
🚀 Technical & Macro Context:
Raytheon Technologies (RTX) is surging amid escalating geopolitical tensions (Iran–Israel conflict) and renewed strength in defense sector fundamentals. The stock has broken multiple resistance levels and is now trading in a parabolic move within a widening bullish channel.
📌 Technically backed setup:
✅ Clear Break of Structure (BoS) confirmed and respected.
🧱 Strong 4H demand zone between $135.25–$130.95.
📉 RSI trending high but not overheated.
📈 MACD remains bullish with wide separation.
This zone aligns with:
Dynamic support (EMA20).
38–50% Fibonacci retracement.
Previous consolidation zone now acting as demand.
🔒 Spread Structure:
Sell Put $140 (Aug 15)
Buy Put $130 (Aug 15)
Probability of Profit (POP): 76%
📉 Invalidation below $130 with volume. Will reassess if demand fails.
📷 The chart already illustrates the setup with institutional logic, break levels, and supply/demand zones.
🔍 If you enjoy structured option setups, technicals with context, and high-probability spreads,
👉 Follow me for more trade ideas like this.
📈 Weekly updates | 🎯 Conviction trades | 🧠 Smart risk-reward
Buy RTX CorporationRTX Corporation (RTX)
RTX is one of the few stocks that have maintained an uptrend in the current drama. I want to be conservative in my entry, as the market is not screaming “GO!”. Look for an entry at volume support levels.
Potential Trade:
Buy May 16 130 Calls as prices hit Entry levels
Entry Level: 130.62 / 129.50
First Profit/Breakeven: 131.85
25% Stop Loss on Each Position.

RTX setting up for a potential retracementMACD daily bearish cross confirmed on NYSE:RTX Friday with multiple confluences. Daily price broke and closed below 10 DSMA with current support at 20 DSMA. A break below 131.47 likely sends price to 128.45, with major support at 127.00. Another promising PUT opportunity for next week.

RTX Aerospace & DefenseCame across RTX while looking for drone companies. I think finding Military defense drone companies that can produce in large scale will do well. Do you know of any companies i should look into? I will be posting the ones i find and giving a read on the charts and adding supports and area of interest levels for value entries that i see.
Avg Vol 30D 4.3M Current Vol 3.83M.
Volume appears to be decreasing.
Under 125 it could break and retest for a flush down to 109. Possible max at area of interest.
Insider Sold Shares Worth $1,813,291, According to a Recent SEC Filing.
If it stays above 125 it could continue higher to 140, 158. GL!

Can Innovation Soar Higher Than the F-22 Itself?Pratt & Whitney, a titan in aerospace propulsion, has clinched a $1.5 billion, three-year contract from the U.S. Air Force to sustain the F119 engines powering the F-22 Raptor, announced on February 20, 2025. This deal is more than a financial milestone; it’s a bold step toward redefining military aviation through innovation and efficiency. With over 400 engines, boasting 900,000 flight hours, under its wing, Pratt & Whitney is tasked with enhancing readiness and slashing costs—ensuring the Raptor remains a predatory force in the skies. Imagine a future where every ounce of thrust is optimized, every maintenance call timed to perfection: this contract dares to make that vision real.
The F119 engine isn’t just machinery; it’s the heartbeat of the F-22, delivering over 35,000 pounds of thrust to pierce altitudes above 65,000 feet and sustain supersonic speeds without afterburners. This supercruise capability stretches fuel efficiency and range, giving pilots an edge in air superiority missions. Coupled with upgrades like next-generation infrared sensors, the F-22 is evolving into a smarter, sharper weapon. But here’s the challenge: can technological leaps like the Usage-Based Lifing (UBL) program, which uses real-time data to predict maintenance needs, truly transform how we sustain such power? With projected savings topping $800 million, Pratt & Whitney suggests yes—pushing readers to ponder the limits of predictive ingenuity.
Financially, this contract is a jetstream of opportunity for Pratt & Whitney, whose 2023 revenue hit $16.2 billion. Against rivals like General Electric and Rolls Royce, this deal fortifies their stronghold in military aviation, promising a steady climb in market influence. Yet beyond dollars, it’s a narrative of ambition: sustaining a fleet that defends nations while pioneering methods that could ripple across industries. What if this blend of power and precision isn’t just about maintaining jets but elevating how we innovate under pressure? The skies are watching—and so should you.

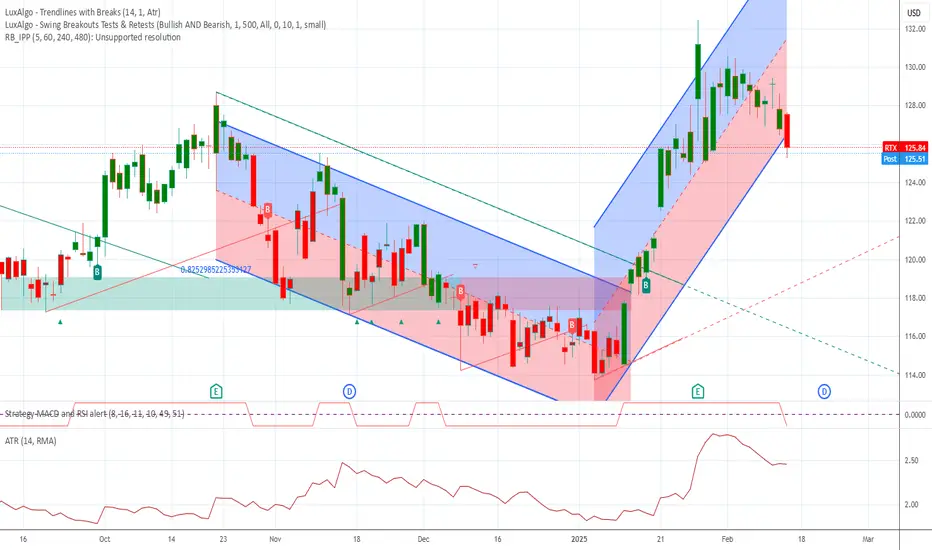
RTX is now Net-Short on Regression Break (Military)RTX is now net-short.
Other military stock are also short at this time, indicating there maybe a change in global tensions.
I will not take this trade
RTX Bullish Momentum – Move Toward $131.00 ExpectedNYSE:RTX is demonstrating strong bullish momentum, supported by moving averages and consistent upward strength in price action. The recent push above $125 confirms that buyers are in control, and suggests a likely continuation toward the $131.00 level.
A pullback toward $125–126 could provide an opportunity for buyers to step in, maintaining the rally's trajectory.
This setup aligns with the expectation of a bullish continuation, offering a potential long opportunity if pullbacks or consolidations occur near current levels.

RTX Corporation to build the Iron Dome?Recently, President Donald Trump issued an executive order directing the Pentagon to develop a missile defense system akin to Israel's Iron Dome, emphasizing the need for space-based interceptors to enhance national security. RTX has expressed strong support for this initiative, highlighting its expertise in missile defense systems.
These developments underscore RTX's commitment to advancing missile defense capabilities in collaboration with international partners and the U.S. government. This raises a few questions but I want to ask you all to share your initial thoughts on this company & should positions be created NOW? I am very bullish based on news but not so much my TA... Share your thoughts please!!

RTX - Strong bullish upside continuation NYSE:RTX is looking at a renewed bullish upside after the stock sees strong bullish break above the falling wedge and as well as the ichimoku kumo, further indicating uptrend confirmation.
The strong bullish break was also supported by the rising volume.
Mid-term wise, Stochastic Oscillator is showing strong oversold crossover, indicating the upside. 23-period ROC is rising and has broken above the zero line. Directional movement index is positive.

RTX Corporation Long on Regression BreakAfter 11%+ fall RTX now has a long bias on the regression break upwards.
The other "military" stock have turned or are starting to turn long.

Raytheon Technologies HTF Trend continuation after some ranging?Here's my analysis on Raytheon Technologies:
Given the ongoing war situation, I've been asked about defense stocks. We're examining a large overarching structure that has reached its resistance line. Previously, the chart showed strong impulsive movements, both upward and downward, as seen in the grey correction. However, at the green structure's resistance line, this impulsiveness has diminished. I expect we won't follow the usual pattern of dropping to the XY correction level to gather momentum. Instead, we'll likely continue correcting, similar to the W wave.
I'm focusing on the orange correction level, anticipating a minor dip into the orange box to start an orange sequence, which could lead us to the green sequence's target levels.

Short time, target 115.83Following weekly and daily chart.
I got a a short signal from my 3 power indicators, but I want to follow the weekly chart, it's cleaner.
TP1 115.83
TP2 108.16 which is more powerful support.
It might seems small amounts but I prefer 3x-5x short, so it's a good opportunity.
I'd stop above 124.
Are you in? Let me know.

RTX is preparing a free fall🟢 RTX is preparing for a free fall
NYSE:RTX is offering a 10% return opportunity today, with a risk of just 2.5% in the deal. RTX experienced a strong trend during 2024, which was broken on November 14th.
✅ What pattern is unfolding in NYSE:RTX ?
RTX has broken a yearly channel and now has created a perfect head and shoulders
pattern.
Head and shoulders appears at the end of trendlines, giving investors the opportunity to join the new trend.
💰 How to trade this chart pattern?
Selling when the blue line is broken is the most optimal idea.
To be sure that I do not fail, I will split my position in 2 take profits, so at least I can pay my stop loss and enter a risk-free trade.
🛡️ The risk management strategy
As we have done in so many previous ideas, remember you can split the position in 2.
- 50% of the position in a take profits, at least, as large as your stop loss (adapt SL and this 1st TP to local supports/resistance levels). In this case, a 3% TP for 2% SL.
- 50% of the position to a price as large as the previous pattern, which would mean a profit of 10% or more. This is also the previous support area and where more volume was traded, so it's just perfect for TP.
✴️ ENJOY AND FOLLOW for more 😊

Raytehon (RTX) Head and Shoulders. Fundamental reasoning: DJT is a peace president vs Biden who allowed build of geopolitical tensions and warfare.
D.O.G.E dept. to radically overhaul the deep state and waste.
Other notable Military contractors include:.
#LMT
Northrup Grumman
Avic
Boeing
General Dynamics
BAE

Key factors affecting stock performance in the near future.Rather than focusing on anything else, we at Zacks prioritize evaluating the change in a company's earnings projection. This is because we believe the fair value for its stock is determined by the present value of its future stream of earnings.
When earnings estimates for a company go up, the fair value for its stock goes up as well. And when a stock's fair value is higher than its current market price, investors tend to buy the stock, resulting in its price moving upward. Because of this, empirical studies indicate a strong correlation between trends in earnings estimate revisions and short-term stock price movements.

$RTX with a bullish outlook following its earnings #StocksThe PEAD projected a bullish outlook for NYSE:RTX after a positive over reaction following its earnings release placing the stock in drift B with an expected accuracy of 85.71%.

Can Defense Industry Giants Turn Global Tensions into SustainablIn a fascinating paradox of modern defense economics, RTX Corporation stands at the epicenter of escalating global security demands while grappling with production constraints that challenge its ability to meet them. With a remarkable $90 billion defense backlog and recent approval for a $744 million missile sale to Denmark, RTX exemplifies how geopolitical tensions are reshaping the aerospace and defense industry landscape. Yet this surge in demand raises profound questions about the sustainability of growth in an industry where production capacity faces inherent limitations.
The company's financial performance tells a compelling story of adaptation and resilience, with its stock attracting increased attention from major analysts and an upward revision of earnings guidance. However, beneath these promising figures lies a more complex narrative: RTX must balance the immediate pressures of global defense requirements against the long-term challenges of production capacity and technological innovation. This delicate equilibrium becomes even more critical as the company serves not just one nation's defense needs, but those of at least 14 allied nations simultaneously.
What emerges is a thought-provoking case study in strategic industrial scaling: How can defense manufacturers like RTX transform short-term geopolitical pressures into sustainable long-term growth? The answer may lie in the company's diversified approach, combining traditional defense contracts with innovative aerospace solutions, while navigating the intricate balance between immediate market demands and long-term strategic planning. This scenario challenges our traditional understanding of defense industry dynamics and forces us to reconsider how global security needs might reshape industrial capacity in the decades to come.

RTX broke 20 year trend lineThe macro environment are favoring the defensive stocks with the on-going + more geopolitical risk, and it was supported by breaking the 20 year trend line for RTX. I would be cautious of entering a big position, but it seems to have more steams left.

$NYSE:RTX Rebound After a Healthy PullbackNYSE:RTX is currently in an uptrend, as evidenced by its strong upward movement, followed by a period of consolidation. This phase is crucial as it allows the stock to gather strength and form a stable base before potentially continuing its upward trajectory.
The RSI indicates that the stock is approaching a neutral range, which suggests it is neither overbought nor oversold at this point. Given the overall trend and the current consolidation, it would be prudent to allow this phase to fully mature. This will provide a clearer indication of whether the stock is ready for a breakout or if it needs further time to stabilize before continuing its trend.
Patience during this phase is key, I'm looking for a breakout beyond 121.40$ to reconsider a position.

RTX; few more years of slow gainLooks like RTX is in the last leg of an ending diagonal as shown in the parallel channel; A-B-C-D-E. I think we can see a corrective wave in toward the $90's which would be a good buying opportunity, once we hit near $130-$150...time to take profits and wait many years for the low between $40 and $70. I think the blue arrow path is the relative future direction.
If we get a sharp steady move like we did in 1995 and 2003, ignore this; especially if the monthly breaks and closes above the channel.
It's unlikely we will see much gains on RTX after 2025-2026 based on this history.
The 1995 massive gain was a 3rd wave which we won't be seeing in our life time; unless you're a teen.
Just wanted to note RTX and many equity charts look great and a nice slope upward, but as you can see there are very long periods of practically no gain. Take that into consideration when managing you portfolio.

RTX retrace below $100?After a year of consistent upward momentum, RTX has entered overbought territory. Despite strong fundamentals, a minor technical correction appears reasonable.

Calm DownThe market isn't that bad, unless you were foolish and bought at the all time high. But unless you invested in Boeing 2 years ago on margin you're probably fine...
